-
Notifications
You must be signed in to change notification settings - Fork 891
Spectrogram
New in Version 1.8
With the spectrogram you can view the frequency spectrum of your signal during time. Simply use this feature via Signal View -> Spectrogram as shown below.

The spectrogram view has three parameters:
- FFT Window Size is the used STFT (Short-Time-Fourier-Transform) window size and determines the time resolution of the spectrogram.
- Datamin is the minimal frequency magnitude for the spectrogram. All magnitudes below Datamin will be set to this value.
- Datamax is the maximal frequency magnitude for the spectrogramm. All magnitudes above Datamax will be set to this value.
You can change the appearance of the spectrogram by changing the colormap using Edit -> Options -> View.
With the spectrogram view you can also apply a bandpass filter to a defined selection and seperate channels from each other or correct misaligned signals. To do this, make a selection around your desired frequency band like this:

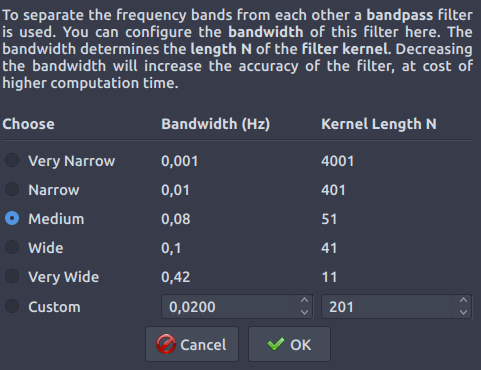
then right click on the spectrogram and select Create signal from frequency selection. A filtered signal will be created and added under the original signal. If you are not pleased with the result, try tuning the filter bandwidth using context menu and click Configure filter bandwidth... to make the following dialog appear:

Here you can e.g. increase accuracy of the filter by choosing a lower bandwidth.