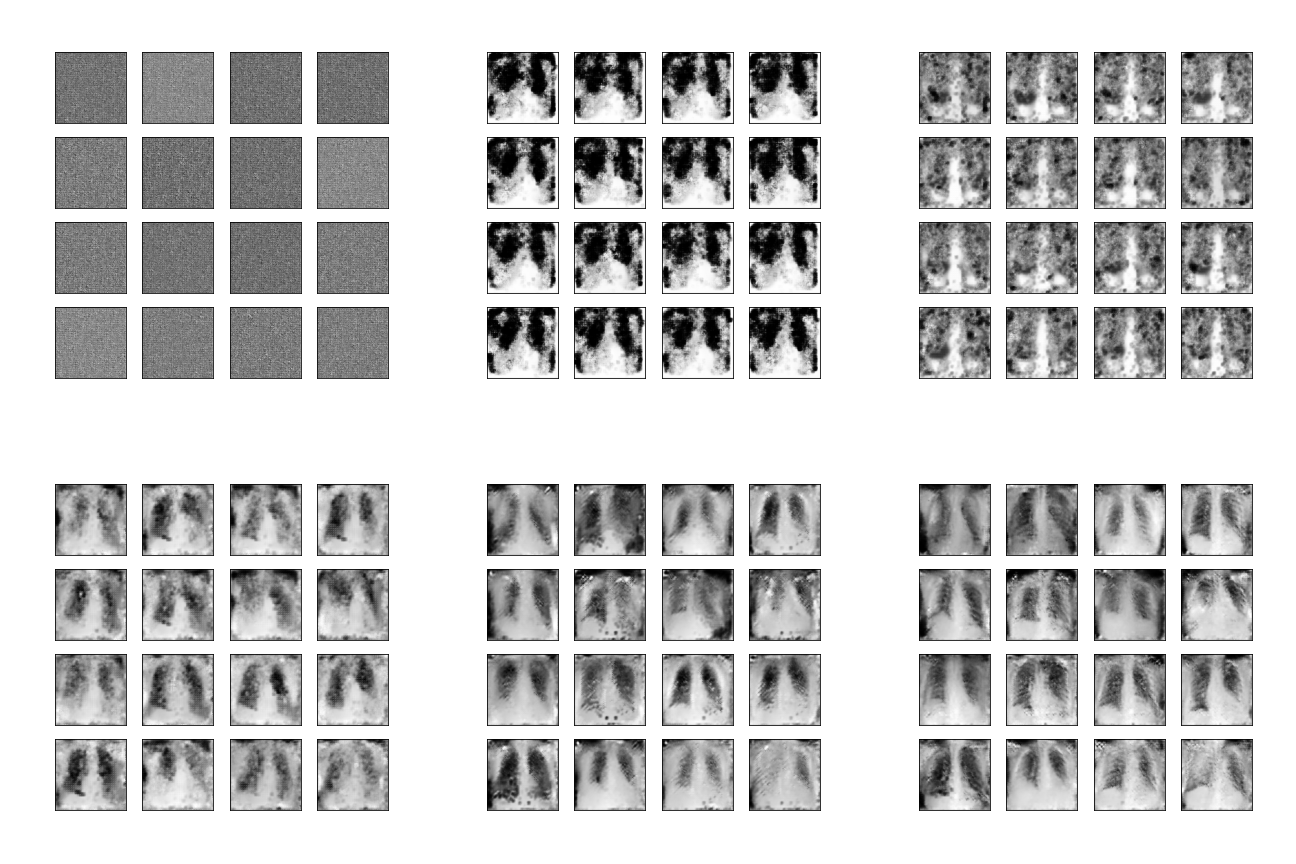
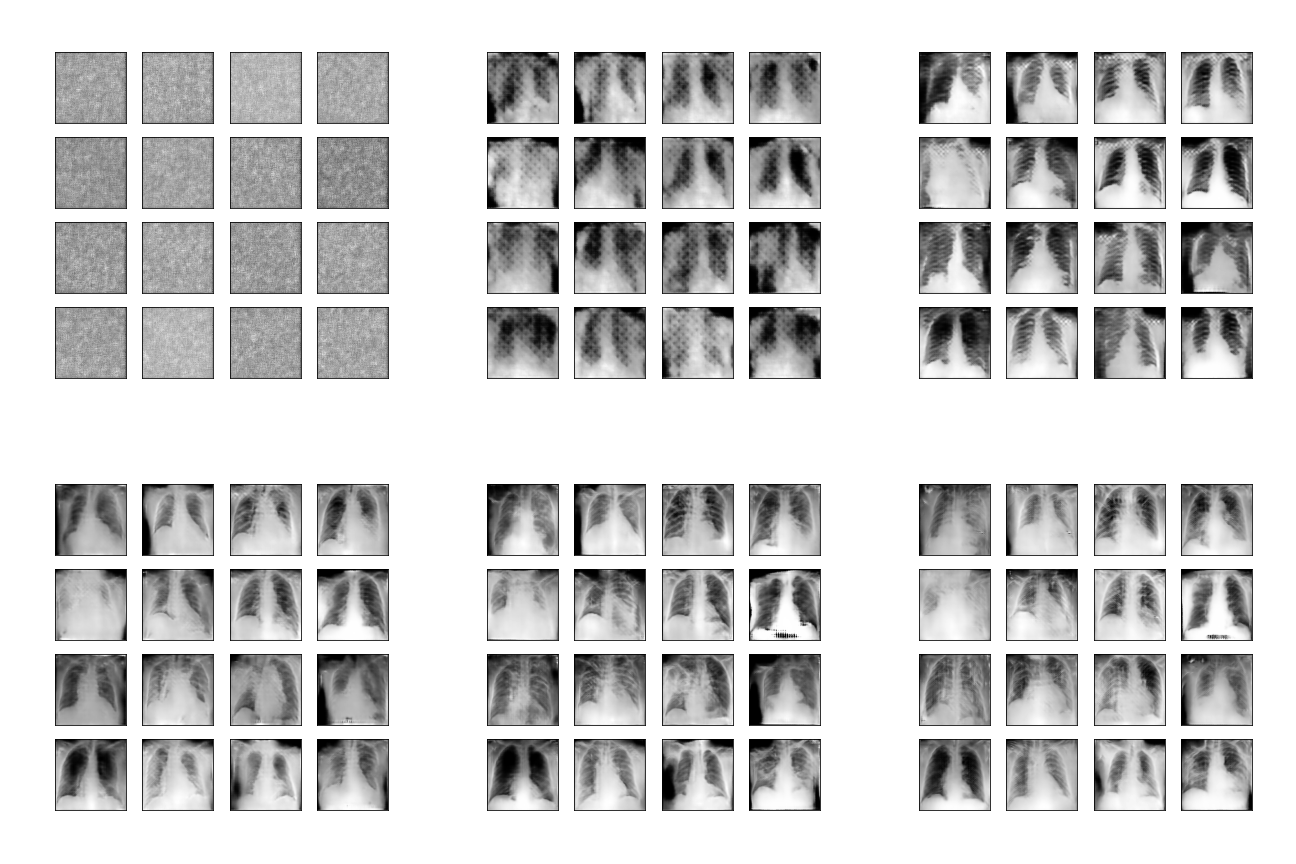
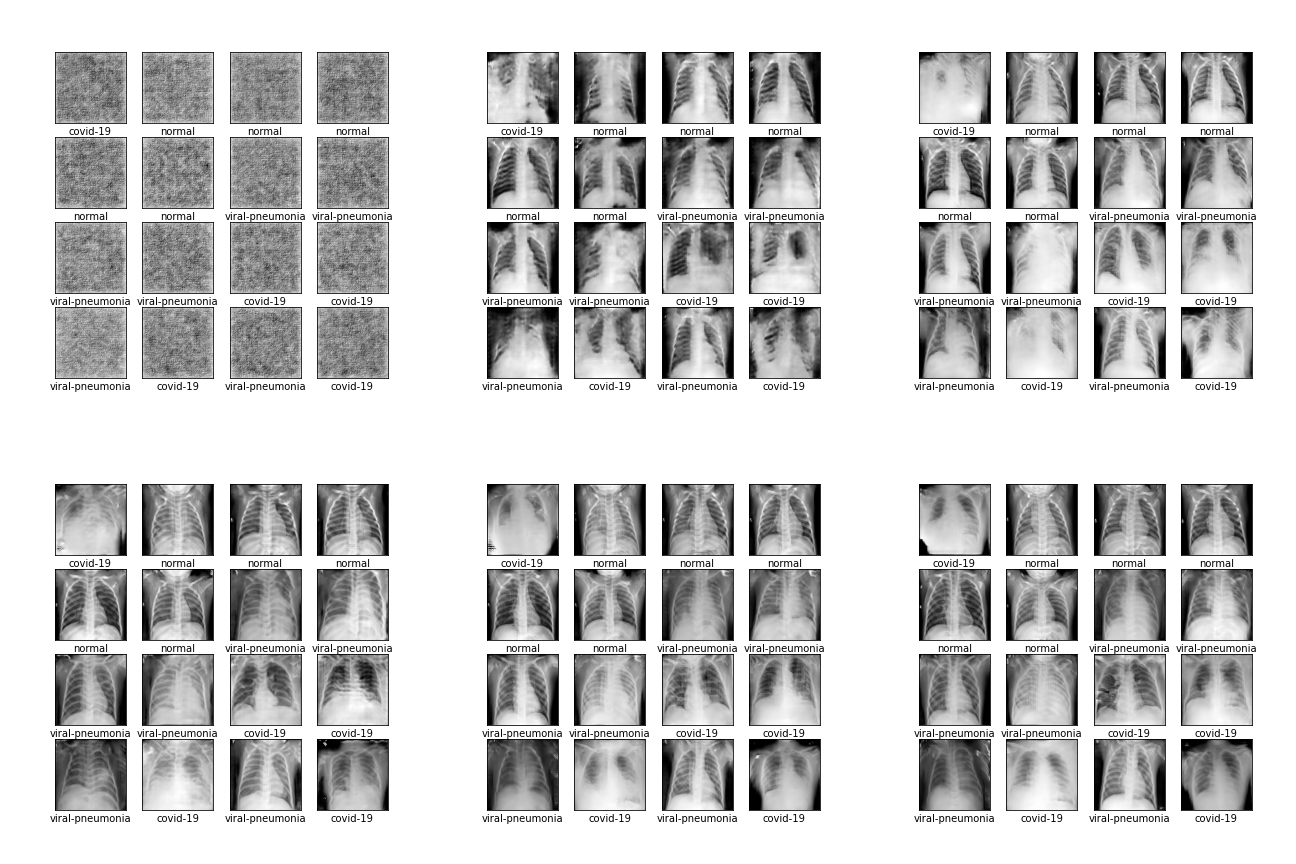
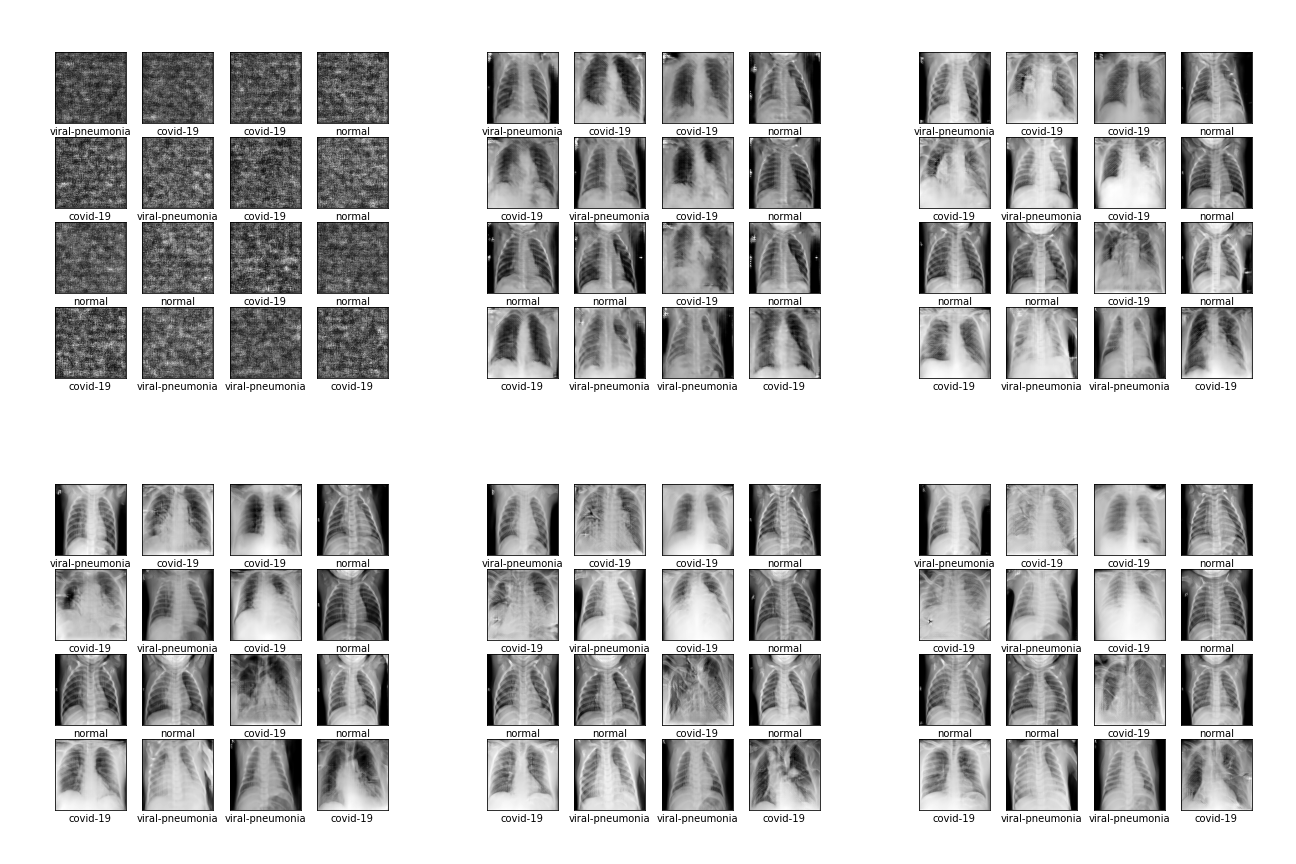
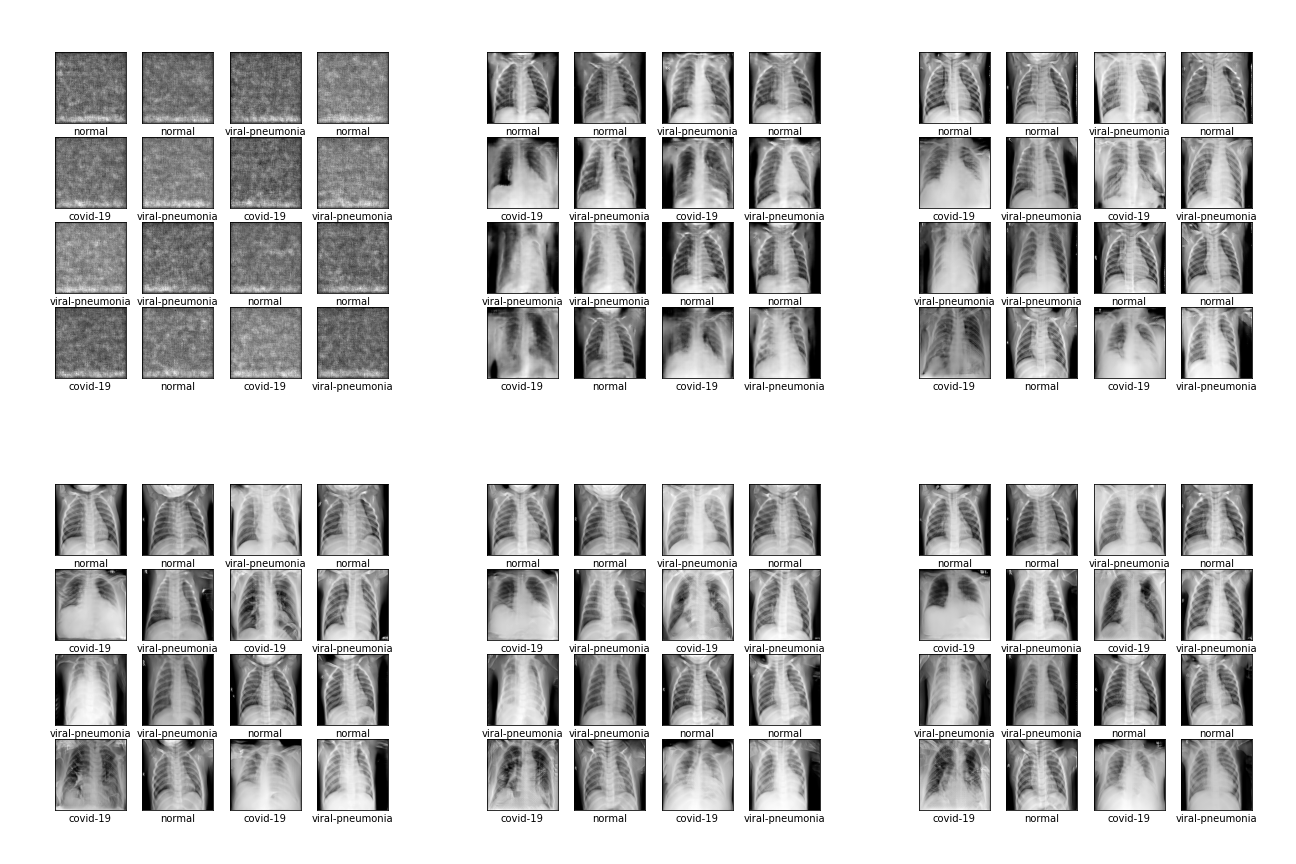
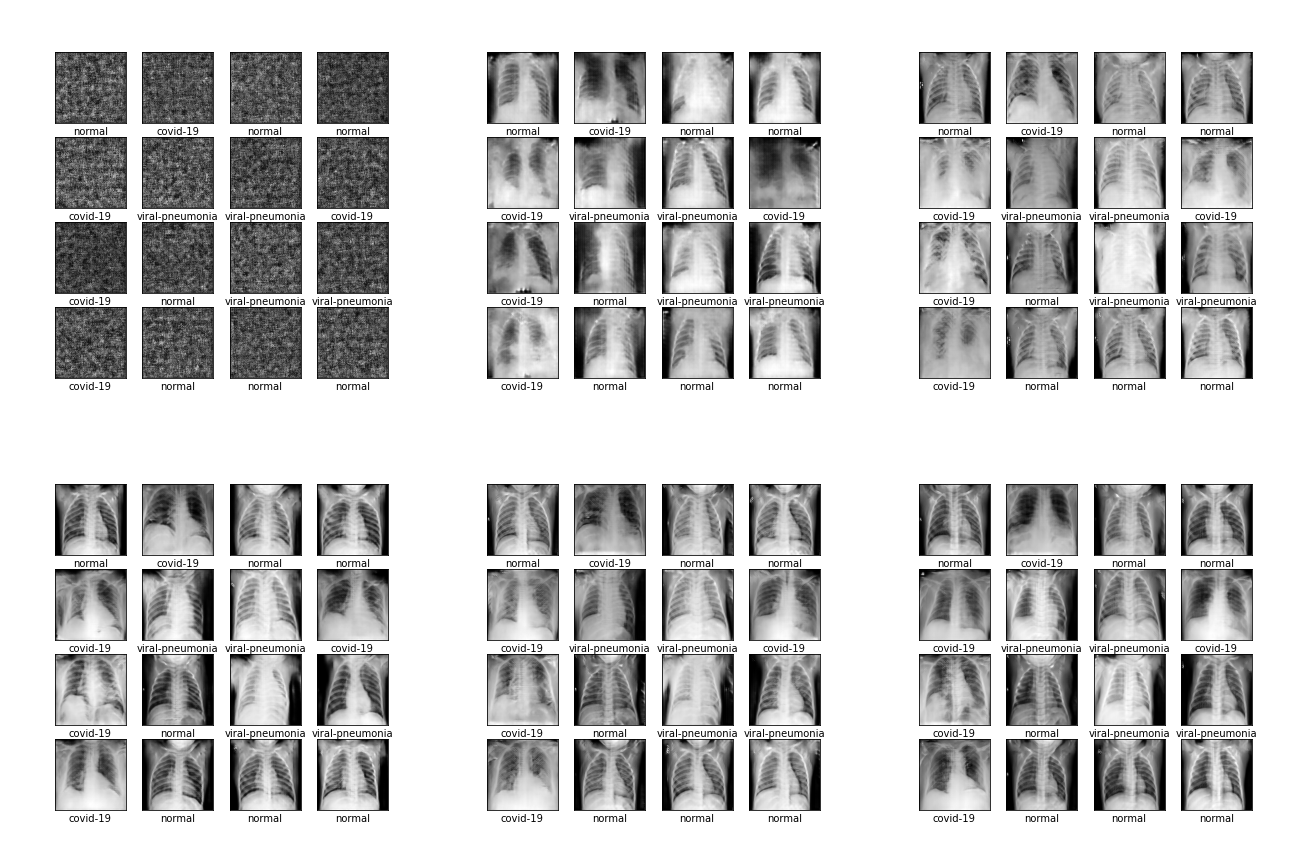
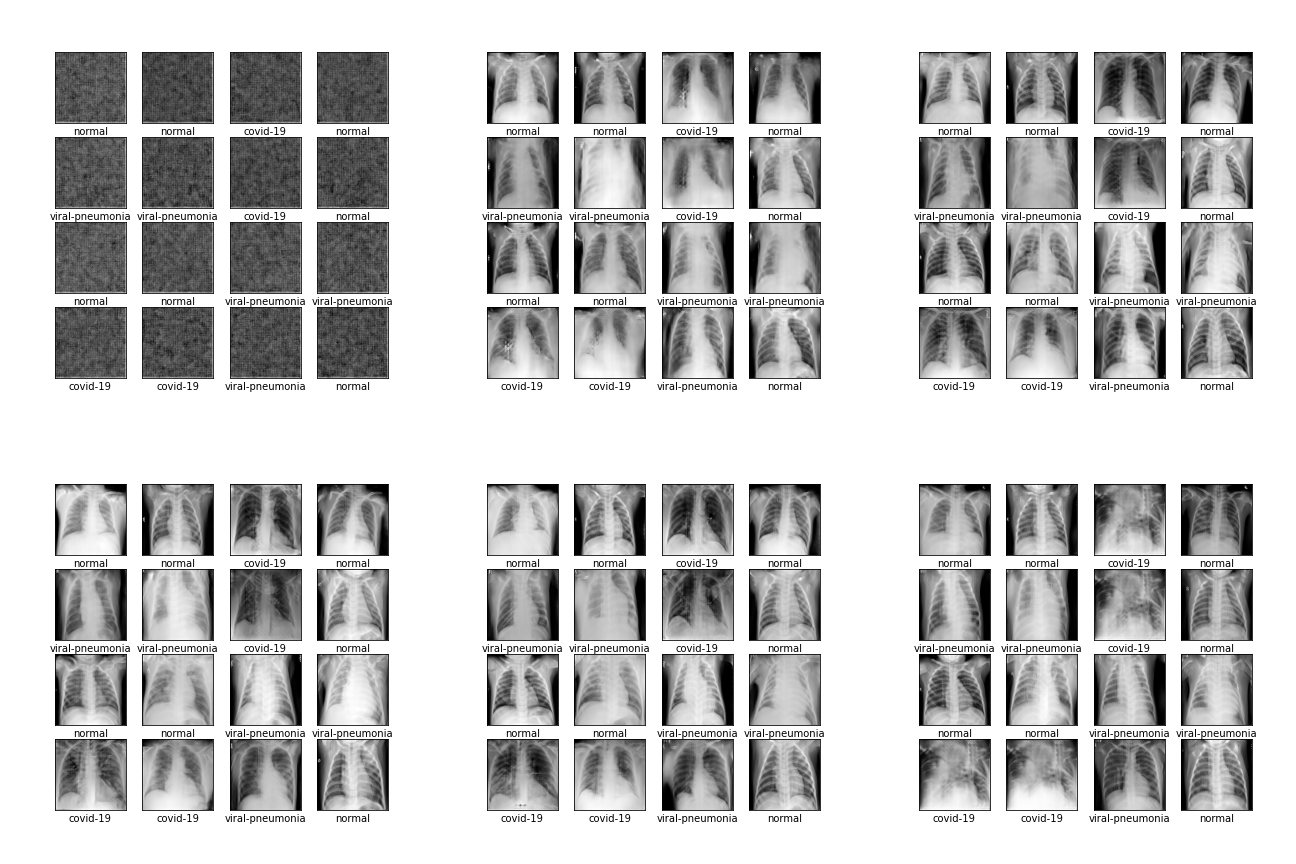
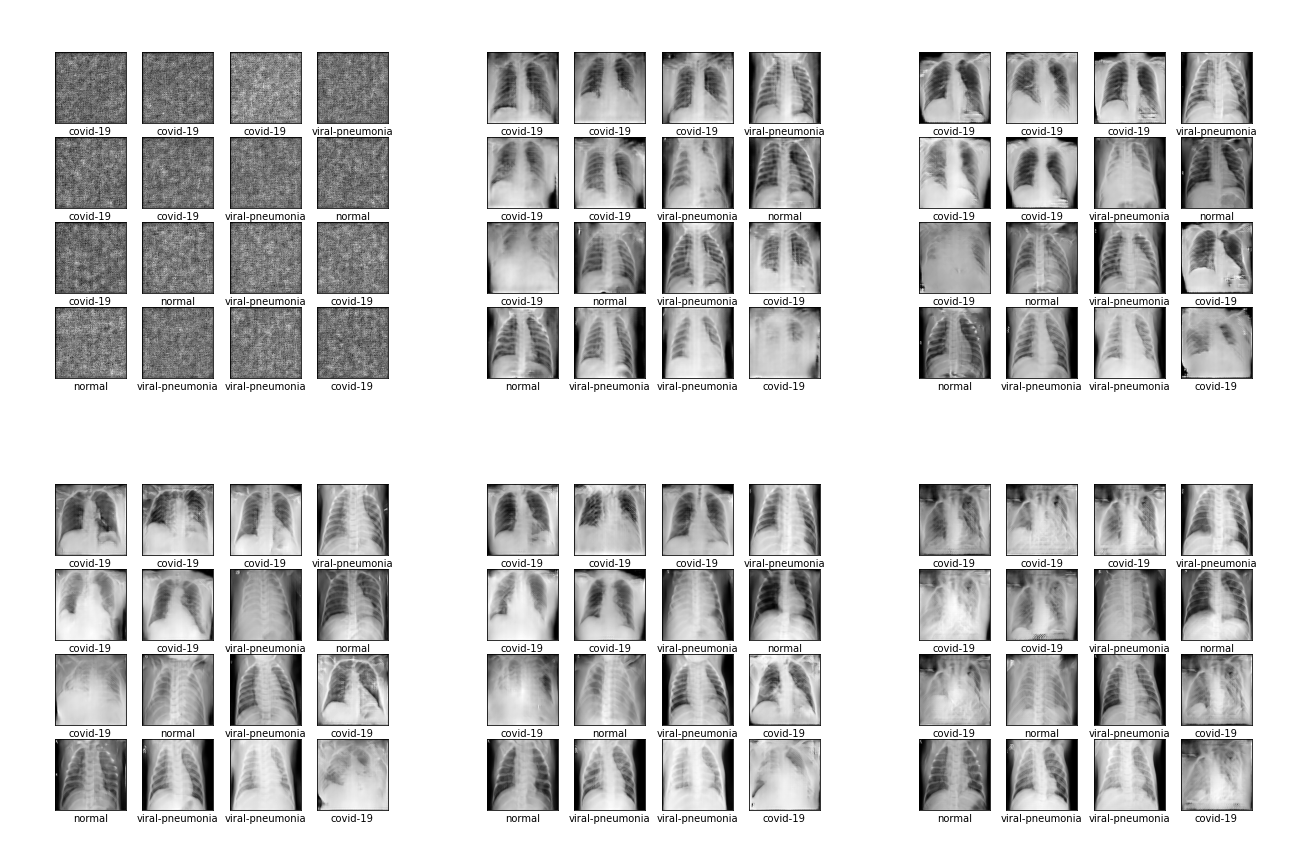
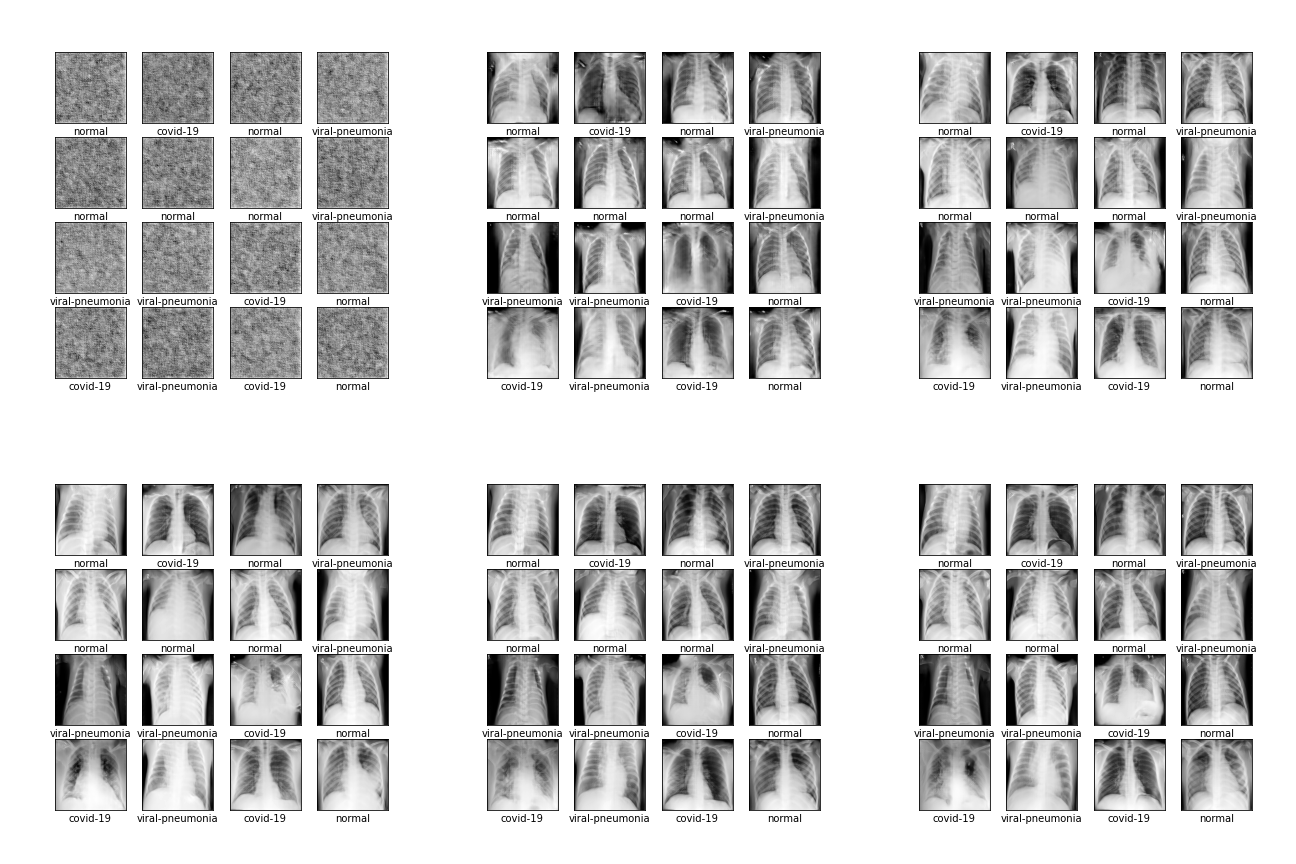
Comparison of different GAN-based synthetic data generation methods applied to chest X-Rays from COVID-19, Viral Pneumonia and Normal patients.
Final project for the course "Bioinformatics", A.Y. 2020/2021. Presentation
Instructions to run the code can be found here.
- Data
- Models
- Experiments
- Tools
- Generation Results
- Classification Results
- Generative Classification Results
- Frechet Inception Distance Results
- References
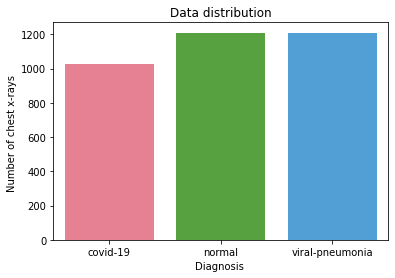
We used the COVID-19 Radiography Database. The dataset contains X-rays images from different patients with different patologies: there are 1027 COVID-19 positive images, 1206 normal images, and 1210 viral pneumonia images.
Starting From the dataset we applied some preprocessing techniques in order to have the data ready for our experiments.
train_test_split.py: create a new folder divided in two subfolders: train and test.resize_images.py: resize all the images in the dataset to 224x224 pixels.
After these passages, we are ready to train our models. Our final dataset can be downloaded here: Modified COVID-19 Radiography Database.
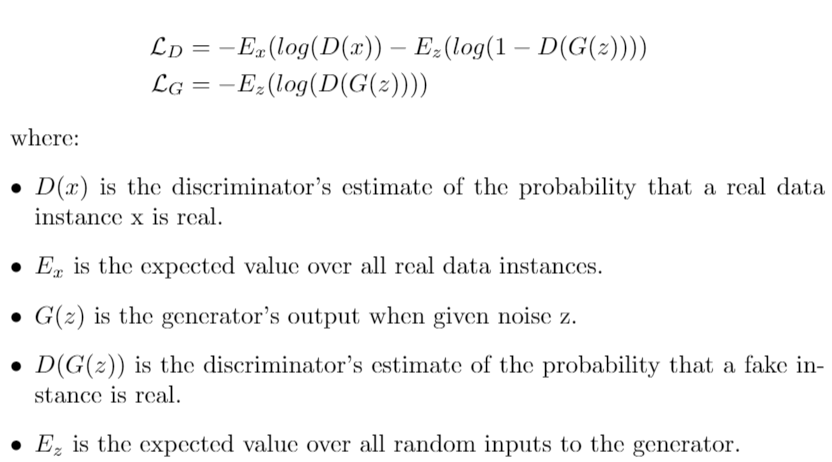
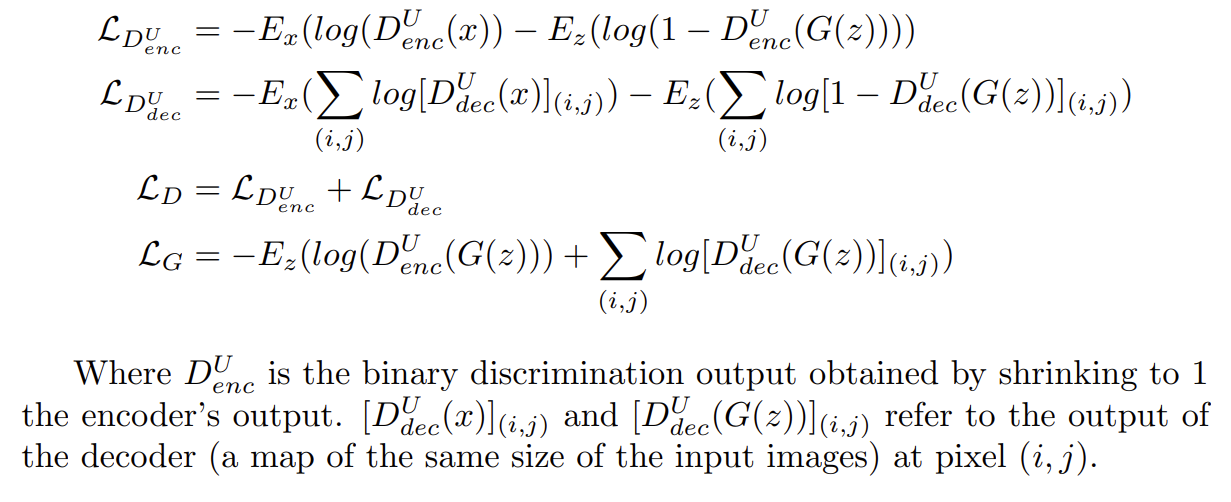
inceptionNet.py: CNN model used for the classification task on COVID-19 Radiography Database. We first loaded the inceptionV3 model with imagenet weights and added more layers at the top. We did not freeze any layer, so during training the preloaded weights from Imagenet are updated.inceptionV3MCD.py: modified version of InceptionV3 implemented in Keras in which dropout is added after each convolutional layer.inceptionNetMCD.py: Monte Carlo Dropout inceptionNet using the inceptionNetV3MCD class.covidGAN.py: Generative Adversial Network to generate synthetic COVID-19 x-rays samples from the COVID-19 Radiography Database database. The loss is defined ascovidUnetCGAN: Particular version of a classical Generative Adversarial Network in which the discriminator is substituted by a U-Net autoencoder. This architecture allows the discriminator to provide a per-pixel feedback to the generator. The network was trained only on the COVID-19 data. The loss is defined as
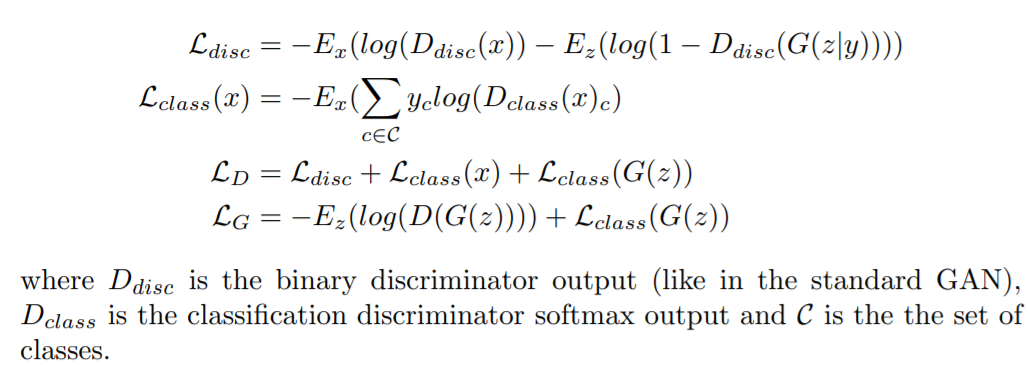
cGAN.py: starting from the covidGAN, we added random labels as input of the generator to generate images according to a given class. This architecture is called Conditional GAN. The loss is defined as where y is the class label. For real images, we used the real labels, for fake images the labels were chosen randomly.
-
unetCGAN.py: Conditional extension of the covidUnetGAN model in which the class conditioning is added. Labels y are added in the definition of the loss as done for the cGAN model. -
ACCGAN.py: The Auxiliary Classifier Conditional GAN is an extension of the cGAN model in which the discriminator instead of receiving the class label as a condition has to predict it. More precisely the discriminator has also the goal of classifying the images rather than just predicting if they are real or fake. The loss is defined as -
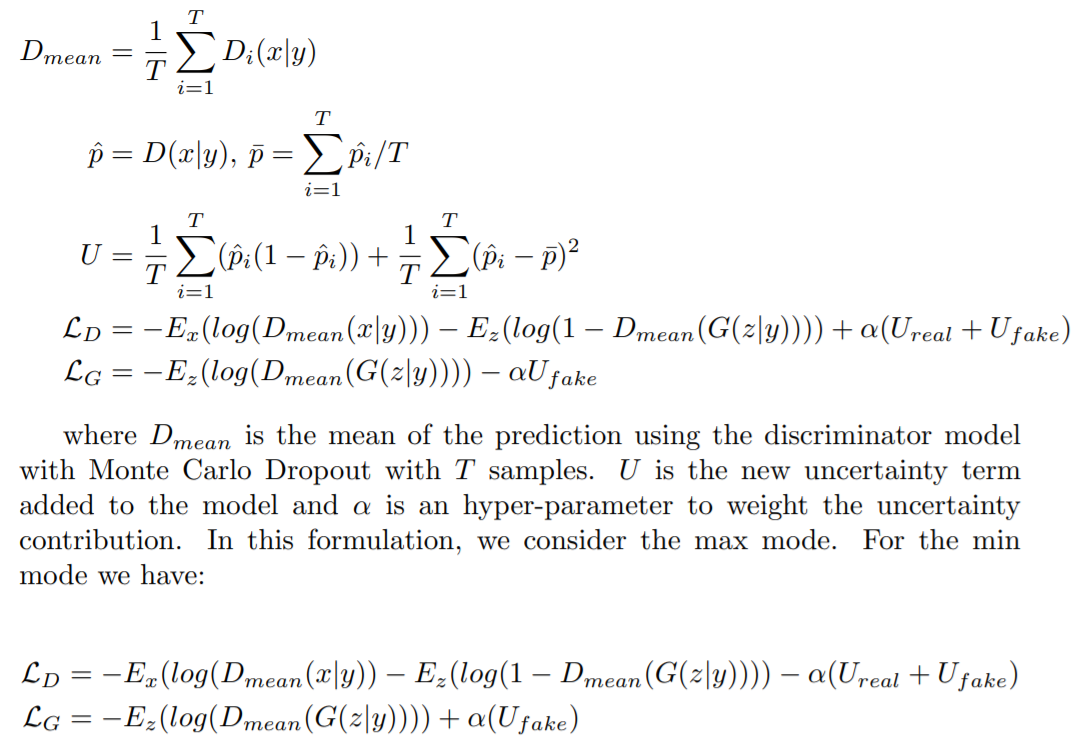
cGAN_Uncertainty.py: cGAN model with the uncertainty regularizer. Uncertainty is computed using MC Dropout at the discriminator and it is inserted into the loss function. This model has two running modes:- Min Uncertainty. In this case the generator is trained to minimize the discriminator's uncertainty on fake images, while the discriminator is trained to maximize it's own uncertainty on both real and fake images.
- Max Uncertainty. Opposite of the min mode, the generator wants to maximize the discriminator's uncertainty while the discriminator wants to minimize it.
The loss is defined as
-
AcCGAN_Uncertainty.py: Uncertainty regularization method applied to the Ac-cGAN model. Uncertainty is applied only at the discriminator binary output, not at the classification output. The model supports the same running modes and uncertainty loss of the cGAN Uncertainty. -
GenerativeClassification.py: Wrapper class that performs the training of a classification network using generated data (from a GAN model) as input. In our experiments we considered a setting in which half of the training data comes from a generative model and half of the data comes from the real training set.
dataExploration.ipynb: visualize the images and the class distribution.inceptionNet.ipynb: notebook reporting the experiments using the inceptionNet model.inceptionNetMCD.ipynb: notebook reporting the experiments using the modified version of the inceptionNet model with Monte Carlo dropout.covidGAN.ipynb: notebook reporting the experiments using the covidGAN model.covidUnetGAN.ipynb: notebook reporting the experiments using the covidUnetGAN model.cGAN.ipynb: notebook reporting the experiments using the cGAN and cGAN_Uncertainty model.unetcGAN.ipynb: notebook reporting the experiments using the unetcGAN model.AC-CGAN.ipynb: notebook reporting the experiments using the ACCGAN and ACCGAN_Uncertainty model.compute_FID.ipynb: notebook reporting the experiments to compute FID for all the generated images by each model.InceptionGenerativeClassification.ipynb: notebook reporting the results of the Inception models trained on generated data.
FID.py: class used to compute FID (Frechet Inception Distance);images_to_gif.py: create a gif from the generated images by the model;plotter.py: utility functions for plotting results;uncertainty.py: utility functions to compute uncertainty for deterministic and Monte Carlo Dropout models;XRaysDataset.py: load and preprocess data from given directory. This tool permits to set the final image size accepted by the model and sets up the prefetching of the dataset for increased performances.
In the table below are reported the overall results on the classification task. The results for the deterministic model are obtained averaging the results over five runs. Instead for the Monte Carlo Dropout models the results are obtained by sampling five times from the network.
| Model | Accuracy | Loss |
|---|---|---|
| inceptionNet (deterministic) | 0.944 ± 0.026 | 0.420 ± 0.274 |
| inceptionNetMCD | 0.907 ± 0.007 | 0.326 ± 0.033 |
| Model | Recall, Covid-19 | Recall, Normal | Recall, Viral Pneumonia |
|---|---|---|---|
| inceptionNet (deterministic) | 0.939 ± 0.066 | 0.966 ± 0.025 | 0.928 ± 0.046 |
| inceptionNetMCD | 0.974 ± 0.007 | 0.894 ± 0.009 | 0.861 ± 0.010 |
| Model | Precision, Covid-19 | Precision, Normal | Precision, Viral Pneumonia |
|---|---|---|---|
| inceptionNet (deterministic) | 1.000 ± 0.000 | 0.917 ± 0.060 | 0.936 ± 0.020 |
| inceptionNetMCD | 0.933 ± 0.009 | 0.922 ± 0.011 | 0.878 ± 0.010 |
To compare the uncertainty of both networks, the following strategies are used:
- inceptionNet (deterministic): in the deterministic net, the uncertainty of a prediction can be computed from the output softmax vector. The uncertainty of the whole test set is expressed as the standard deviation of the softmax vector for every image.
- inceptionNetMCD: in the Monte Carlo Dropout setting, we compute for T times the predictions of the net (T here is set to 100). In this case the uncertainty is the following:
Once we compute the uncertainties for both networks, the experiments can be easily compared using barplots. For the MCD experiments a low level of uncertainty means the network is sure about the prediction and viceversa. The deterministic net (left) behave as expected, even if the accuracy is high on the test set, most of the prediction may be quite overconfident as the network assigns high probabilities values to samples. Instead the Monte Carlo Dropout network (right) is less overconfident in the predictions. The behaviour can be fully explored by filtering the predictions in correct and wrong.
Plotting only correct or wrong predictions shows that the Monte Carlo Dropout network is working in the desired way. For correct predictions, most of them have a lower uncertainty. Instead, for the wrong ones, the uncertainty is very high. The deterministic network on the other hand is overconfident about its predictions even for the wrongly classified samples.
To test the abilities of our model in generating meaningful data we decided to train an Inception classifier with data coming from the GANs, using as baseline the results obtained in the previous section by training a deterministic model only on the real data. For the generative classification (GC) experiments (classification model trained with generated data) we used a setting in which at each training batch half of the data comes from the real dataset and half is generated with a GAN model. In this way the total amount of training samples seen by the network is the same and the results can be compared with the baseline. Results are averaged over 5 runs.
| Model | Accuracy | Loss |
|---|---|---|
| Baseline | 0.944 ± 0.026 | 0.420 ± 0.274 |
| cGAN | 0.959 ± 0.007 | 0.203 ± 0.046 |
| cGAN + uncertainty (min) | 0.968 ± 0.008 | 0.119 ± 0.042 |
| cGAN + uncertainty (max) | 0.965 ± 0.004 | 0.167 ± 0.054 |
| AC-CGAN | 0.948 ± 0.016 | 0.246 ± 0.092 |
| AC-CGAN + uncertainty (min) | 0.950 ± 0.008 | 0.180 ± 0.061 |
| AC-CGAN + uncertainty (max) | 0.956 ± 0.011 | 0.206 ± 0.063 |
| Model | Recall, Covid-19 | Recall, Normal | Recall, Viral Pneumonia |
|---|---|---|---|
| Baseline | 0.939 ± 0.066 | 0.966 ± 0.025 | 0.928 ± 0.046 |
| cGAN | 0.974 ± 0.012 | 0.930 ± 0.019 | 0.973 ± 0.017 |
| cGAN + uncertainty (min) | 0.981 ± 0.007 | 0.960 ± 0.023 | 0.966 ± 0.010 |
| cGAN + uncertainty (max) | 0.979 ± 0.009 | 0.951 ± 0.013 | 0.967 ± 0.012 |
| AC-CGAN | 0.979 ± 0.009 | 0.894 ± 0.039 | 0.975 ± 0.007 |
| AC-CGAN + uncertainty (min) | 0.977 ± 0.017 | 0.921 ± 0.017 | 0.954 ± 0.027 |
| AC-CGAN + uncertainty (max) | 0.977 ± 0.009 | 0.922 ± 0.024 | 0.970 ± 0.016 |
| Model | Precision, Covid-19 | Precision, Normal | Precision, Viral Pneumonia |
|---|---|---|---|
| Baseline | 1.000 ± 0.000 | 0.917 ± 0.060 | 0.936 ± 0.020 |
| cGAN | 1.000 ± 0.000 | 0.972 ± 0.016 | 0.917 ± 0.023 |
| cGAN + uncertainty (min) | 0.997 ± 0.007 | 0.966 ± 0.009 | 0.948 ± 0.019 |
| cGAN + uncertainty (max) | 1.000 ± 0.000 | 0.965 ± 0.014 | 0.937 ± 0.007 |
| AC-CGAN | 0.995 ± 0.004 | 0.971 ± 0.014 | 0.897 ± 0.037 |
| AC-CGAN + uncertainty (min) | 0.995 ± 0.004 | 0.955 ± 0.028 | 0.912 ± 0.011 |
| AC-CGAN + uncertainty (max) | 1.000 ± 0.000 | 0.961 ± 0.023 | 0.921 ± 0.029 |
We repeated the same experiments of the previous sections, but this time using the InceptionNet MCD classification model. The following Accuracy, Precision and Recall results are obtained by sampling five times from the MCD model.
| Model | Accuracy | Loss |
|---|---|---|
| Baseline | 0.907 ± 0.007 | 0.326 ± 0.033 |
| cGAN | 0.944 ± 0.003 | 0.183 ± 0.008 |
| cGAN + uncertainty (min) | 0.934 ± 0.003 | 0.260 ± 0.025 |
| cGAN + uncertainty (max) | 0.939 ± 0.005 | 0.311 ± 0.043 |
| AC-CGAN | 0.926 ± 0.003 | 0.260 ± 0.018 |
| AC-CGAN + uncertainty (min) | 0.908 ± 0.007 | 0.270 ± 0.019 |
| AC-CGAN + uncertainty (max) | 0.930 ± 0.008 | 0.243 ± 0.009 |
| Model | Recall, Covid-19 | Recall, Normal | Recall, Viral Pneumonia |
|---|---|---|---|
| Baseline | 0.974 ± 0.007 | 0.894 ± 0.009 | 0.861 ± 0.010 |
| cGAN | 0.947 ± 0.010 | 0.907 ± 0.010 | 0.977 ± 0.016 |
| cGAN + uncertainty (min) | 0.961 ± 0.009 | 0.866 ± 0.016 | 0.978 ± 0.005 |
| cGAN + uncertainty (max) | 0.951 ± 0.009 | 0.870 ± 0.011 | 0.994 ± 0.003 |
| AC-CGAN | 0.951 ± 0.007 | 0.921 ± 0.017 | 0.906 ± 0.014 |
| AC-CGAN + uncertainty (min) | 0.956 ± 0.009 | 0.870 ± 0.004 | 0.904 ± 0.017 |
| AC-CGAN + uncertainty (max) | 0.962 ± 0.004 | 0.913 ± 0.012 | 0.918 ± 0.013 |
| Model | Precision, Covid-19 | Precision, Normal | Precision, Viral Pneumonia |
|---|---|---|---|
| Baseline | 0.933 ± 0.009 | 0.922 ± 0.011 | 0.878 ± 0.010 |
| cGAN | 0.994 ± 0.004 | 0.973 ± 0.015 | 0.891 ± 0.008 |
| cGAN + uncertainty (min) | 0.991 ± 0.001 | 0.975 ± 0.005 | 0.860 ± 0.007 |
| cGAN + uncertainty (max) | 0.987 ± 0.007 | 0.988 ± 0.004 | 0.867 ± 0.006 |
| AC-CGAN | 0.989 ± 0.009 | 0.898 ± 0.010 | 0.904 ± 0.019 |
| AC-CGAN + uncertainty (min) | 0.959 ± 0.004 | 0.904 ± 0.014 | 0.873 ± 0.007 |
| AC-CGAN + uncertainty (max) | 0.991 ± 0.001 | 0.896 ± 0.015 | 0.918 ± 0.010 |
As additional results we report here the uncertainty plots for the MCD generative classification tasks. Uncertainty is compute by sampling from the network 100 times.
To measure the quality of the generated images compared to the original ones, we use a technique called Frechet Inception Distance. Given the statistics of the real and the generated images, the distance is computed as an improvement of the Inception Score (IS) in the following way:
To run the experiments, we create 5 different sets of points from the latent space and/or random labels.| Model | FID |
|---|---|
| covidGAN | 313.84 ± 2.48 |
| covidUnetGAN | 188.48 ± 3.84 |
| cGAN | 80.65 ± 1.27 |
| cGAN + uncertainty (min) | 72.68 ± 0.92 |
| cGAN + uncertainty (max) | 62.59 ± 0.61 |
| unetCGAN | 89.76 ± 2.03 |
| AC-CGAN | 81.87 ± 1.85 |
| AC-CGAN + uncertainty (min) | 89.65 ± 1.45 |
| AC-CGAN + uncertainty (max) | 78.54 ± 1.59 |
Generative Adversial Network (Goodfellow et al., 2014)
A U-Net Based Discriminator for Generative Adversarial Networks (Schonfeld et al., CVPR 2020)
Conditional Generative Adversarial Nets (Mirza et al., 2014)
Conditional Image Synthesis with Auxiliary Classifier GANs (Odena et al., 2017)
Rethinking the Inception Architecture for Computer Vision (Szegedy et al., 2015)

