Mackerel is an integrated monitoring platform which is available at https://mackerel.io. This repository is created to provide an example how to utilize AWS Lambda Scheduled Event in order to communicate with Mackerel endpoint. For simplicity, this example is provided for SQS monitoring.
- boto3
- mackerel.clienthde
Step 1
Configure your Mackerel and AWS related configuration in conf.json. After that, you can run make in order to create lambda.zip.
Step 2
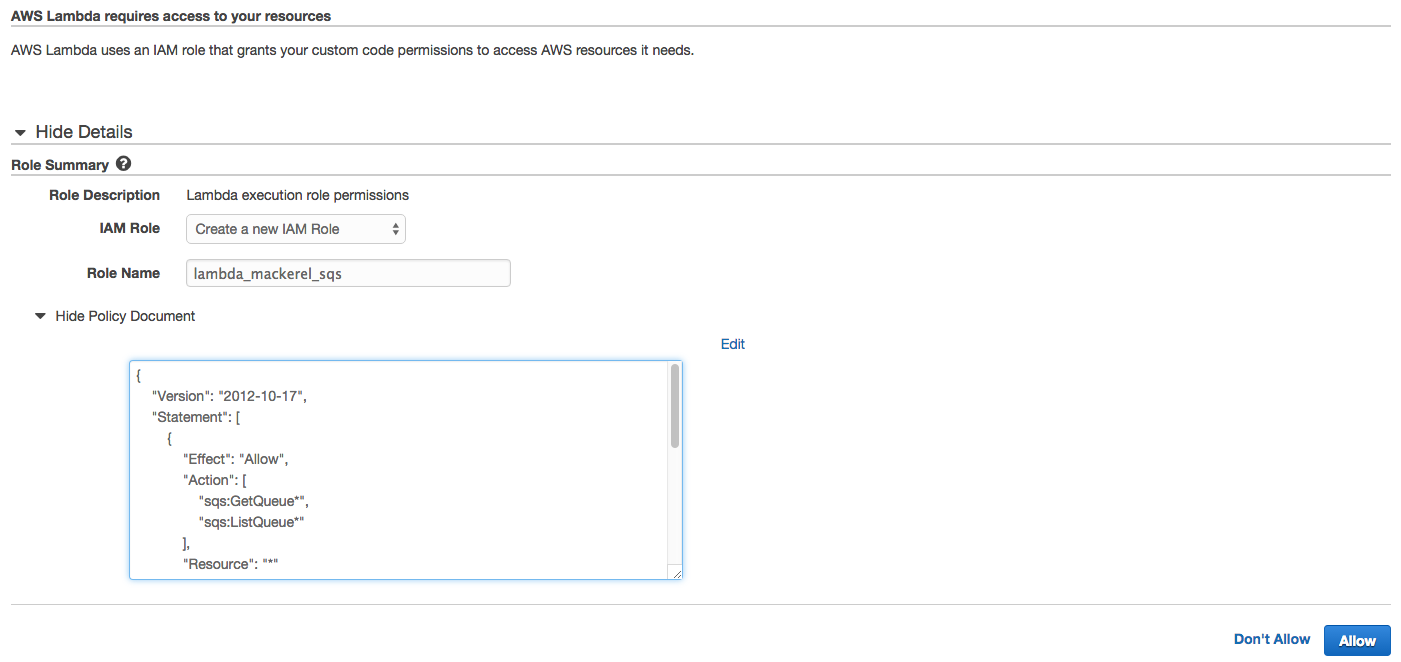
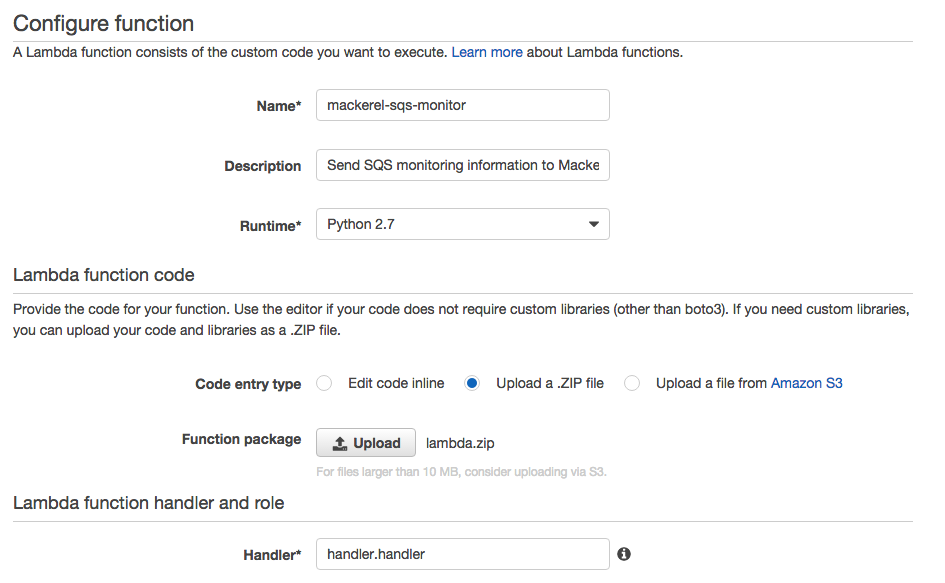
Upload the resulted lambda.zip to AWS Lambda. In the role part, create a new role based on the value of lambda-iam-role.json. Specify handler.handler at the Handler part. For Memory and Timeout, we can specify the lowest Memory (128 MB) and set the Timeout to some reasonable value (~30s).
Step 3
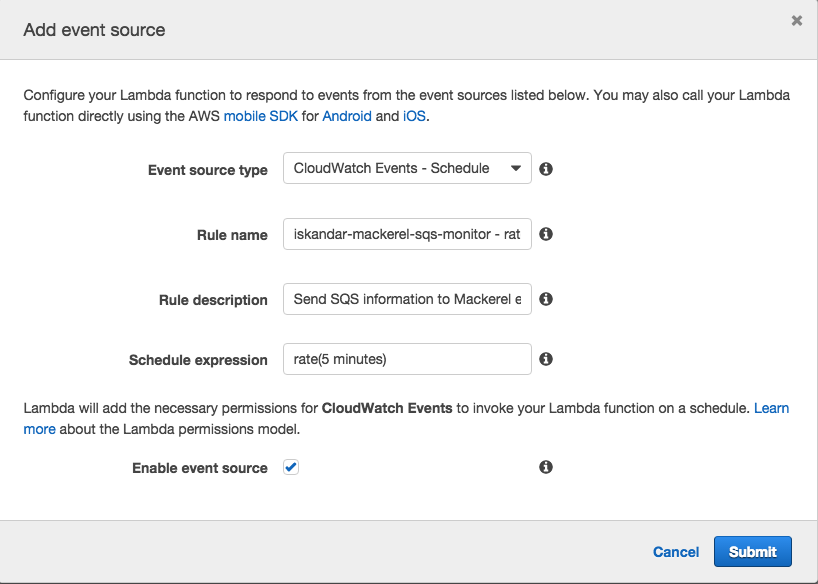
In the Event sources tab, click on "Add event source". Choose "CloudWatch Events - Schedule" as the source type. For the present time, we cannot schedule "Schedule expression" which is lower than 5-minute rate. If you're interested in implementing more fine-grained cronjob, you can check the following video from AWS re:Invent 2015 out. It tries to utilize Lambda + Cloudwatch + SNS as the 1-minute time signal. Hopefully, AWS will provide a support for better schedule events in the near future.
AWS finally provides 1-minute rate support!
Step 4
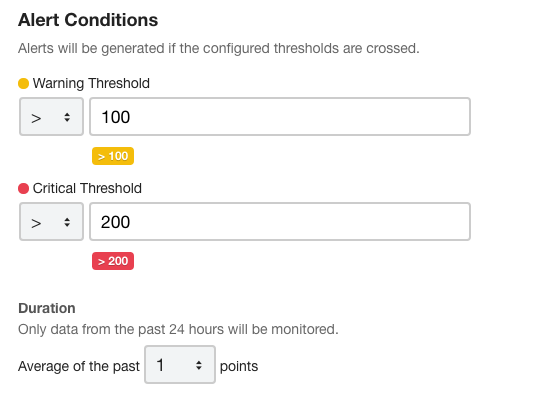
After enabling the scheduled event above, we can access Mackerel dashboard to add new Service monitor. You can add a warning & critical limit based on the information that you sent via Lambda. For example, I want Mackerel to notify me via Slack & email if the number of message in my SQS queue is above 100 for Warning and 200 for Critical.
Of course, you can utilize this Lambda mechanism for other AWS services: DynamoDB throughput limits, Healthy hosts in ELB, etc.
Mackerel has a good dashboard for entire system monitoring. You can also configure it in your instance internally to propagate Docker statistics, CPU loads, etc.
MIT License.
Last Updated: July 15, 2016


