-
Notifications
You must be signed in to change notification settings - Fork 0
MCCL Sample Input And Output
Carole Hayakawa edited this page Jun 10, 2021
·
15 revisions
- Please refer to the "Getting Started" pages to generate sample infiles using the command line argument "geninfiles"
- One of the infiles generated is infile_one_layer_ROfRho_FluenceOfRhoAndZ.txt
- Edit the file and specify the number of photons to be launched to be 10,000: "N": 10000,
- Run the file according to the instructions on the "Getting Started" pages for your particular system (Linux, Windows, Mac)
-
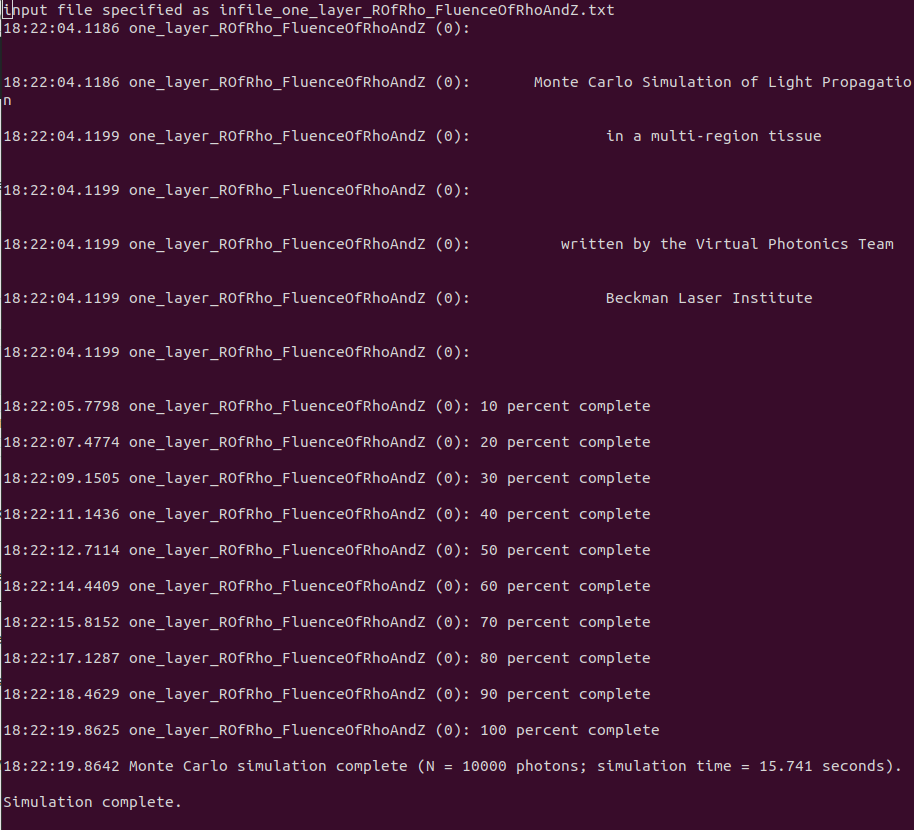
This is the output to my Linux screen:

-
To plot results, again follow instructions on the "Getting Started" to edit load_results_script.m and modify "datanames" to be "one_layer_ROfRho_FluenceOfRhoAndZ": datanames = { 'one_layer_ROfRho_FluenceOfRhoAndZ ' };
-
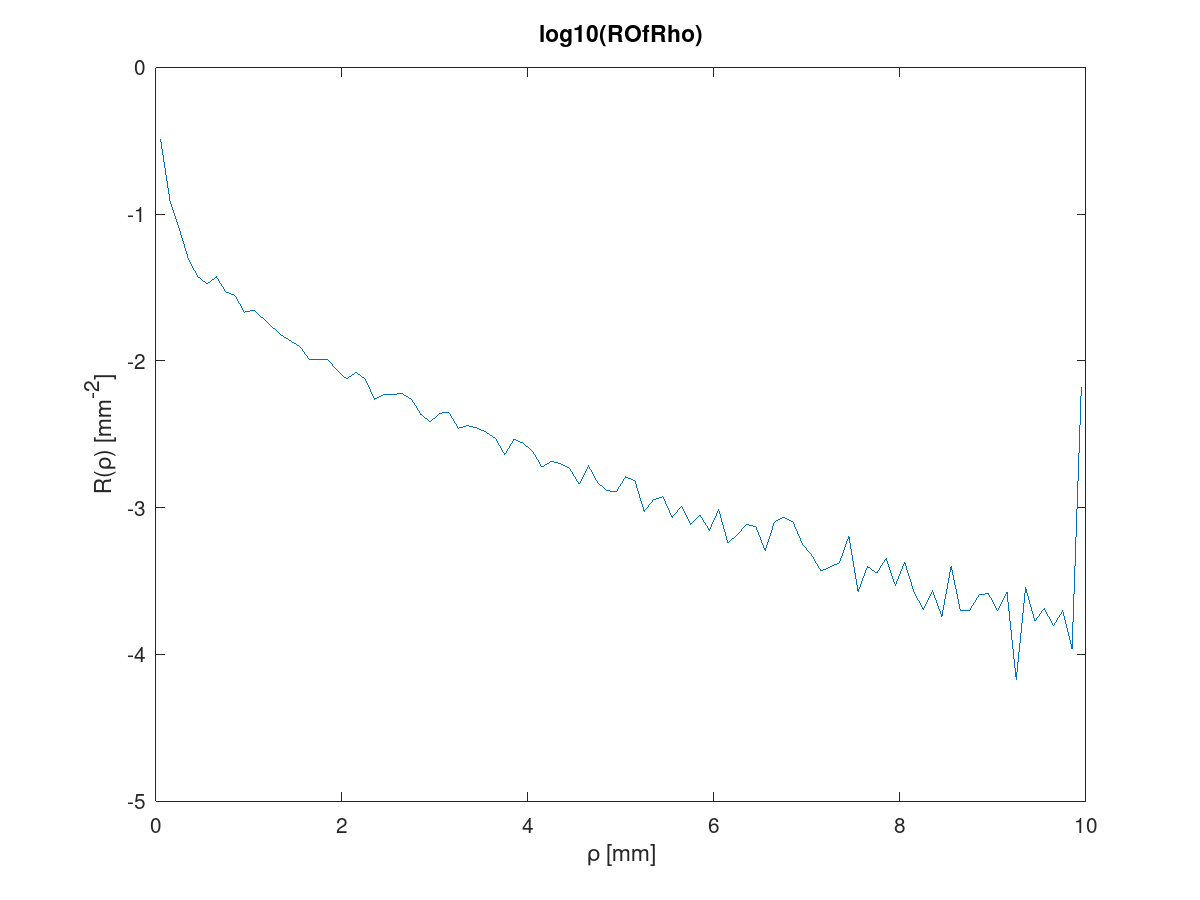
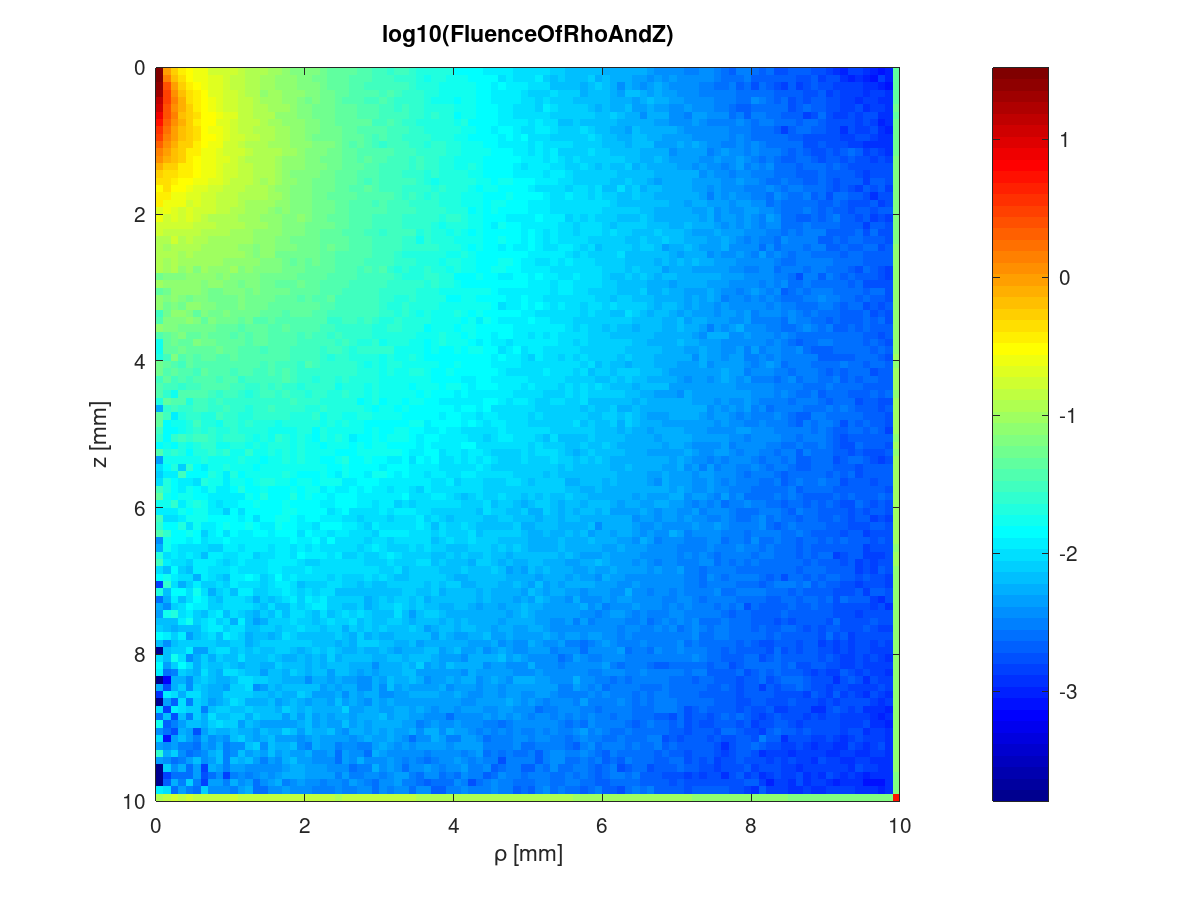
Open MATLAB or Octave and run load_results_script.m. These are the plots displayed:


- Notice on the ROfRho plot that the plot rises at the last rho bin. This is because the photons that exit the tissue beyond the last rho bin will get tallied to the last rho bin. We do that so that when the tallies in all bins are un-normalized by the area of the respective circular ring and summed, total diffuse reflectance results.
- Similarly for the FluenceOfRhoAndZ, the last rho and z bins capture the tallies beyond those bins and so the edge of the fluence plot looks brighter.
Virtual Photonics Technology Initiative
Project Site | Discussion | Education
- Getting Started
- Editing infiles
- Examples
- Capabilities & Implementation
- Source, Tissue, Detector Options
- Post Processor
- Inverse Solutions
- Parallel Processing
- Validation & Comparison with MCML
- References
- FAQ
- Downloads & Latest Release