Myvi is a 3D visualization tool, the name comes from mayavi (Myvi is a lighter one, it also means mine), Myvi is not as powerful as Mayavi, but to do some simple work it is enough, what is more, mayavi has a heavy dependence, vtk, traits, chaco..., it is difficult to install, has many historical burdens, and did not support wxpython-phoenix. However, myvi just needs ModernGL, supports wxpython-phoenix and you can use Myvi's Manager with any UI Framework (such as QT) easily.
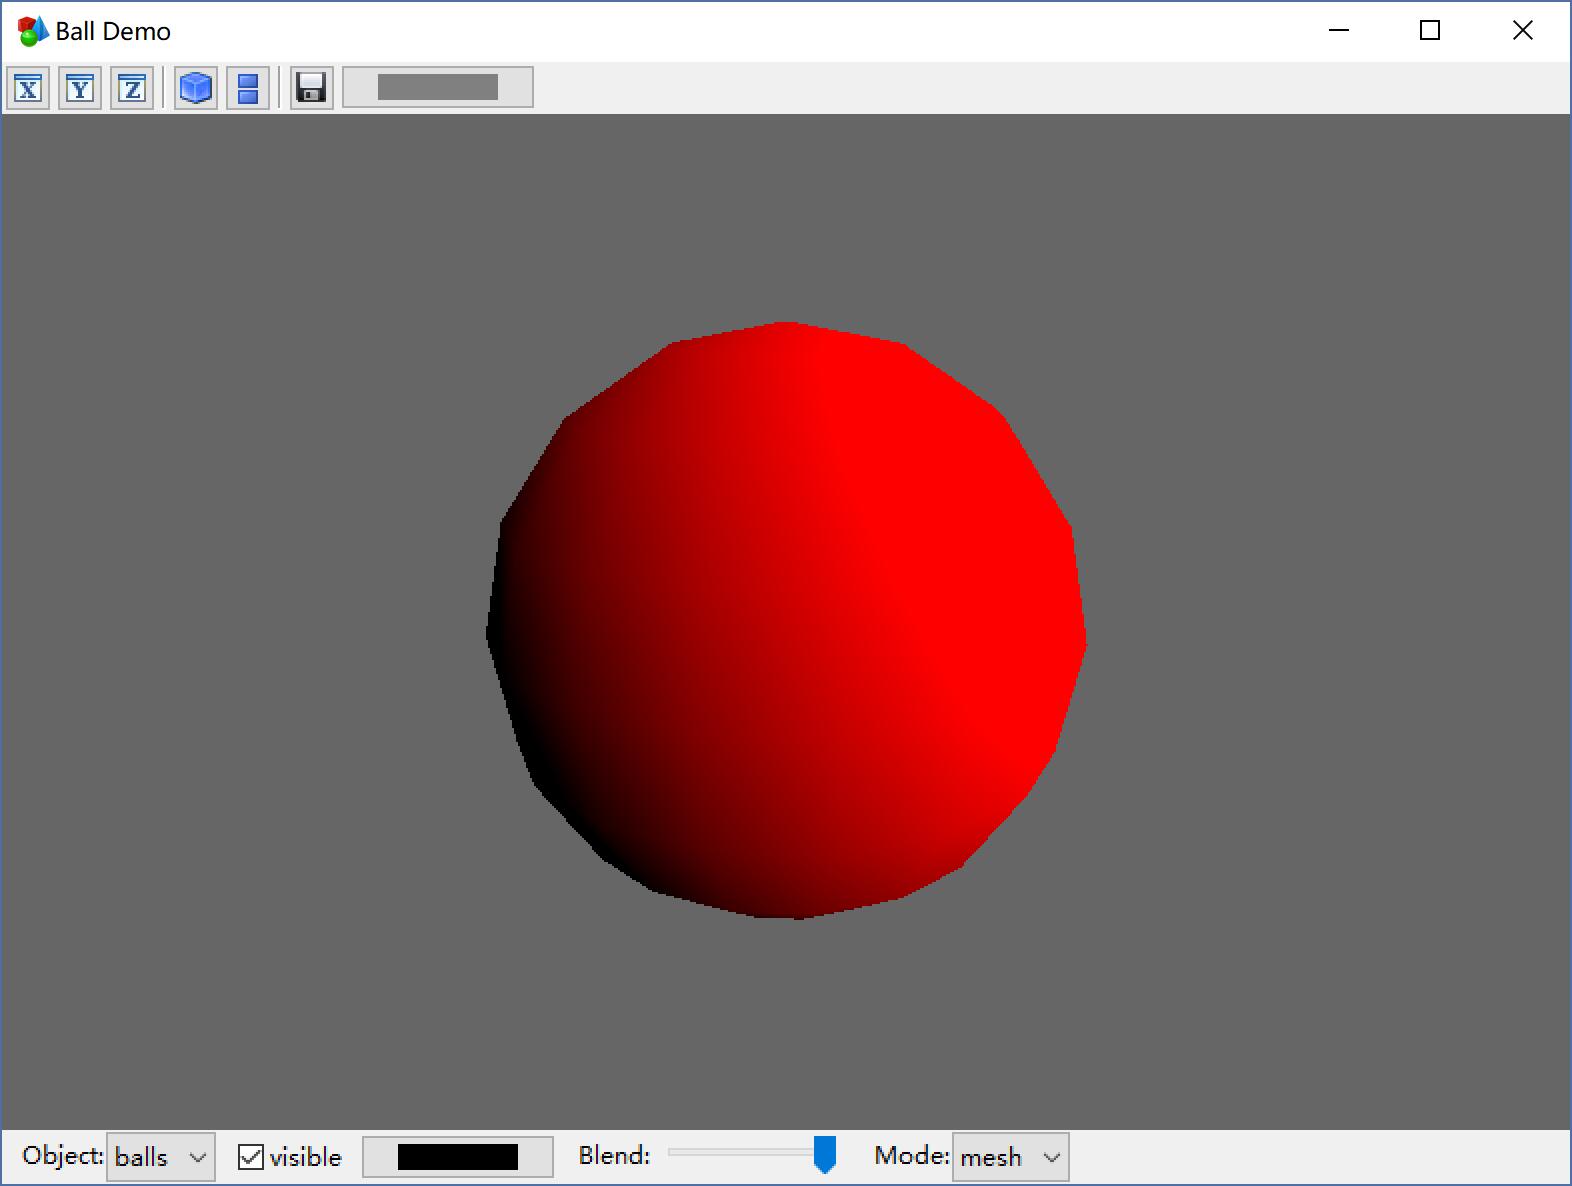
# give position, r, and color
vts, fs, ns, cs = myvi.build_ball((100,100,100), 50, (1,0,0))

manager = myvi.Manager()
manager.add_surf('balls', vts, fs, ns, cs)
manager.show('Ball Demo')os = np.random.rand(30).reshape((-1,3))
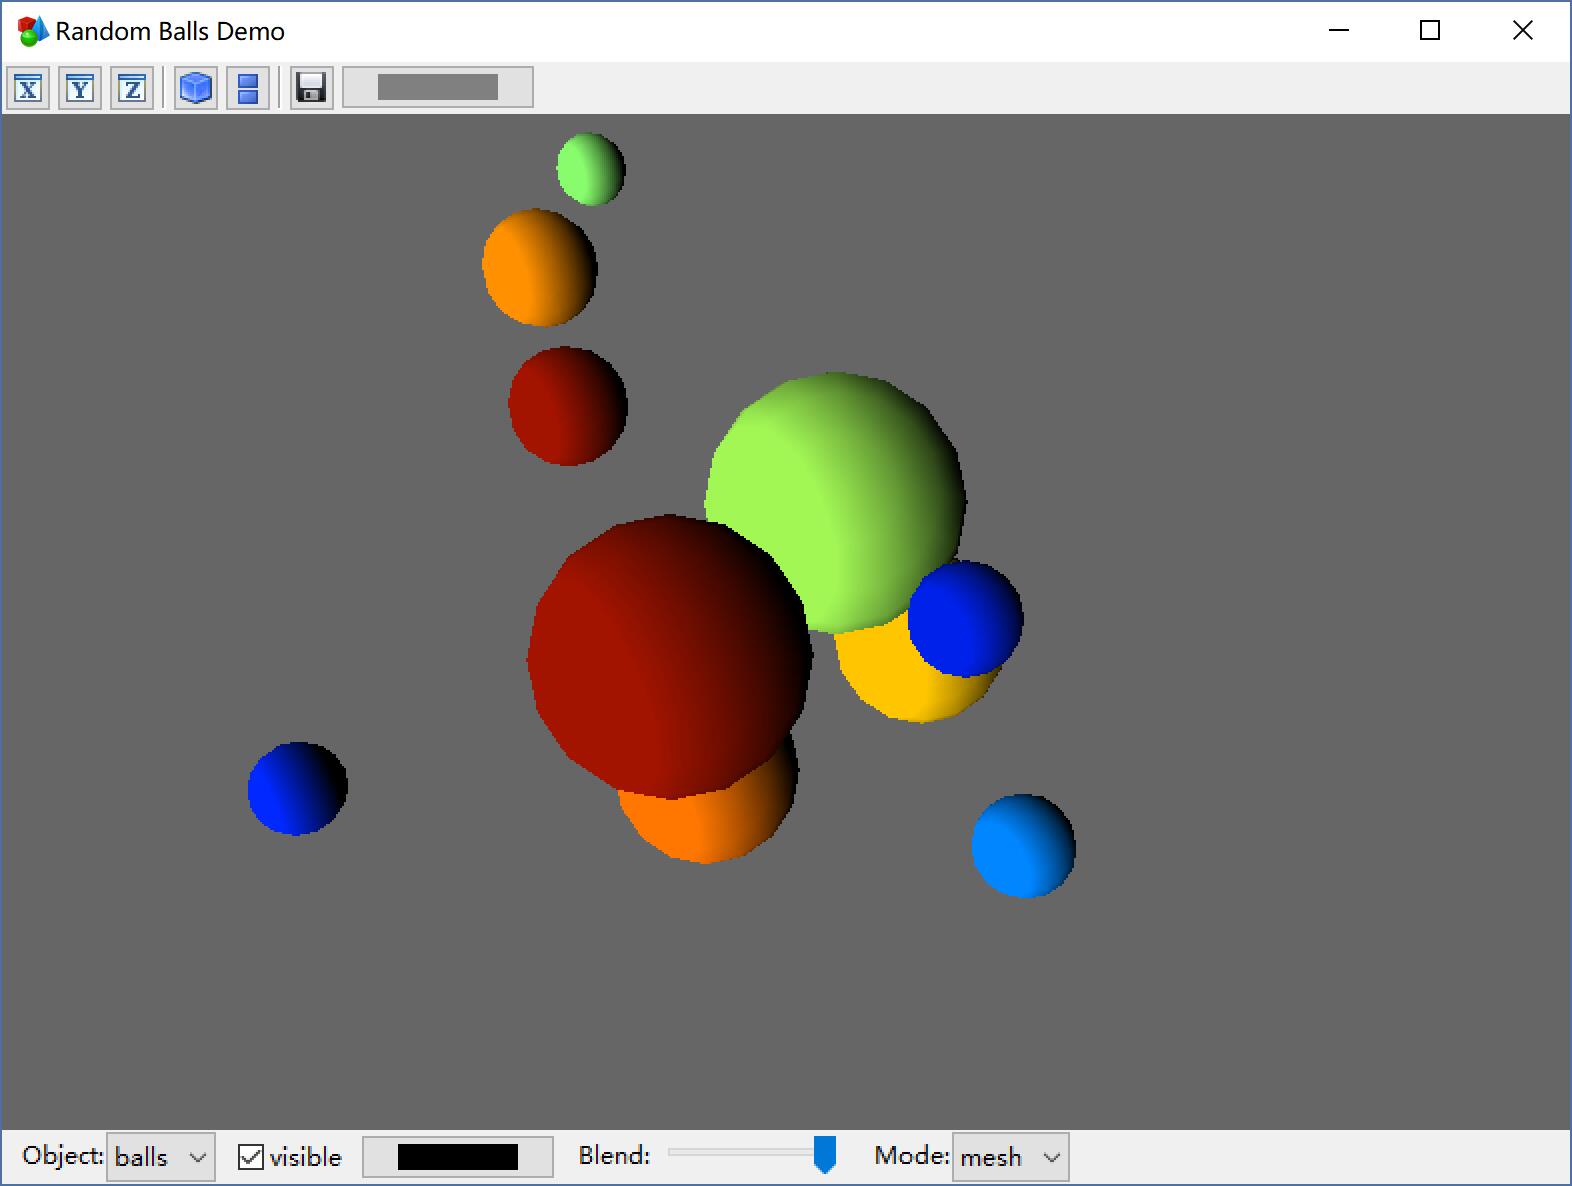
rs = np.random.rand(10)/5
cs = (np.random.rand(10)*255).astype(np.uint8)
cs = myvi.linear_color('jet')[cs]/255
vts, fs, ns, cs = myvi.build_balls(os, rs, cs)
manager = myvi.Manager()
manager.add_surf('balls', vts, fs, ns, cs)
manager.show('Random Balls Demo')os = np.random.rand(30).reshape((-1,3))
rs = np.random.rand(10)/7
cs = (np.random.rand(10)*255).astype(np.uint8)
cs = myvi.linear_color('jet')[cs]/255
vts_b, fs_b, ns_b, cs_b = myvi.build_balls(os, rs, cs)
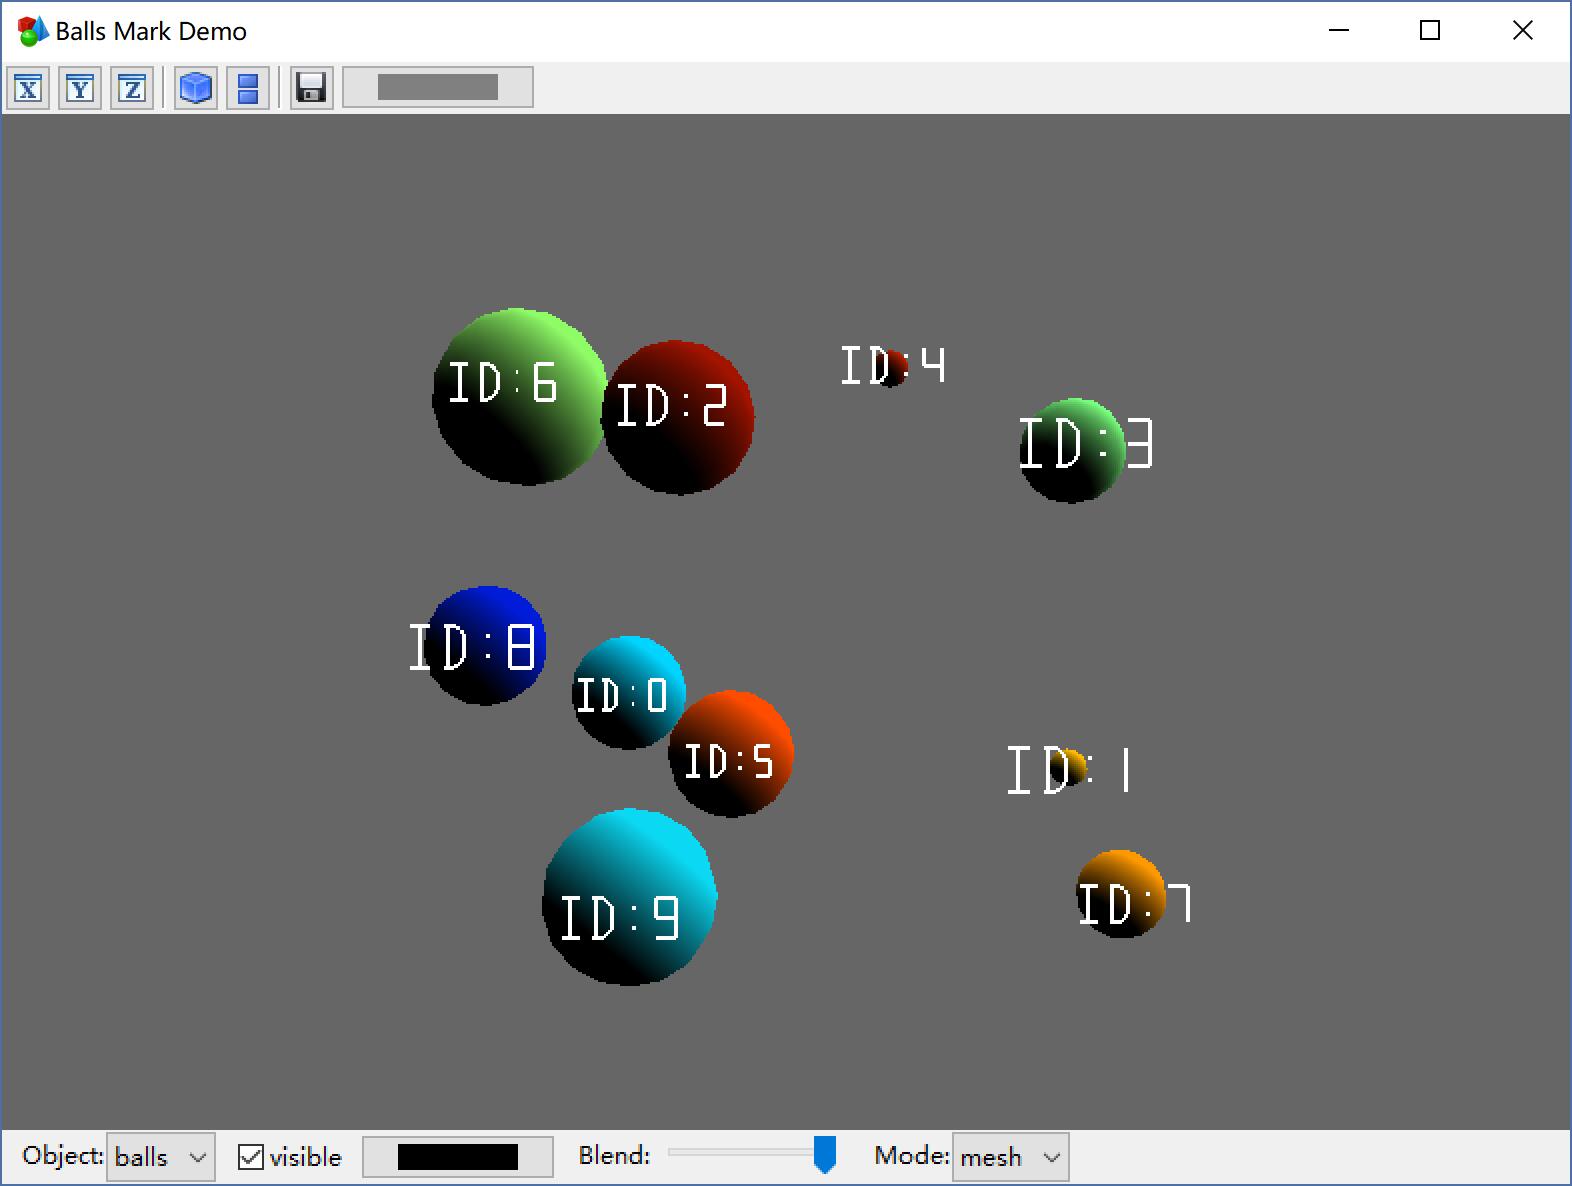
cont = ['ID:%s'%i for i in range(10)]
vtss, fss, pps, h, color = myvi.build_marks(cont, os, rs, 0.05, (1,1,1))
manager = myvi.Manager()
manager.add_surf('balls', vts_b, fs_b, ns_b, cs_b)
line = manager.add_mark('line', vtss, fss, pps, h, color)
line.set_style(mode='grid')
manager.show('Balls Mark Demo')vts = np.array([(0,0,0),(1,1,0),(2,1,0),(1,0,0)], dtype=np.float32)
fs = np.array([(0,1,2),(1,2,3)], dtype=np.uint32)
ns = np.ones((4,3), dtype=np.float32)
n_mer, n_long = 6, 11
pi = np.pi
dphi = pi / 1000.0
phi = np.arange(0.0, 2 * pi + 0.5 * dphi, dphi)
mu = phi * n_mer
x = np.cos(mu) * (1 + np.cos(n_long * mu / n_mer) * 0.5)
y = np.sin(mu) * (1 + np.cos(n_long * mu / n_mer) * 0.5)
z = np.sin(n_long * mu / n_mer) * 0.5
vts, fs, ns, cs = myvi.build_line(x, y, z, (1, 0, 0))
cs[:] = myvi.auto_lookup(vts[:,2], myvi.linear_color('jet'))/255
manager = myvi.Manager()
obj = manager.add_surf('line', vts, fs, ns, cs)
obj.set_style(mode='grid')
manager.show('Line Rings')os = np.random.rand(30).reshape((-1,3))
rs = np.random.rand(10)/7
cs = (np.random.rand(10)*255).astype(np.uint8)
cs = myvi.linear_color('jet')[cs]/255
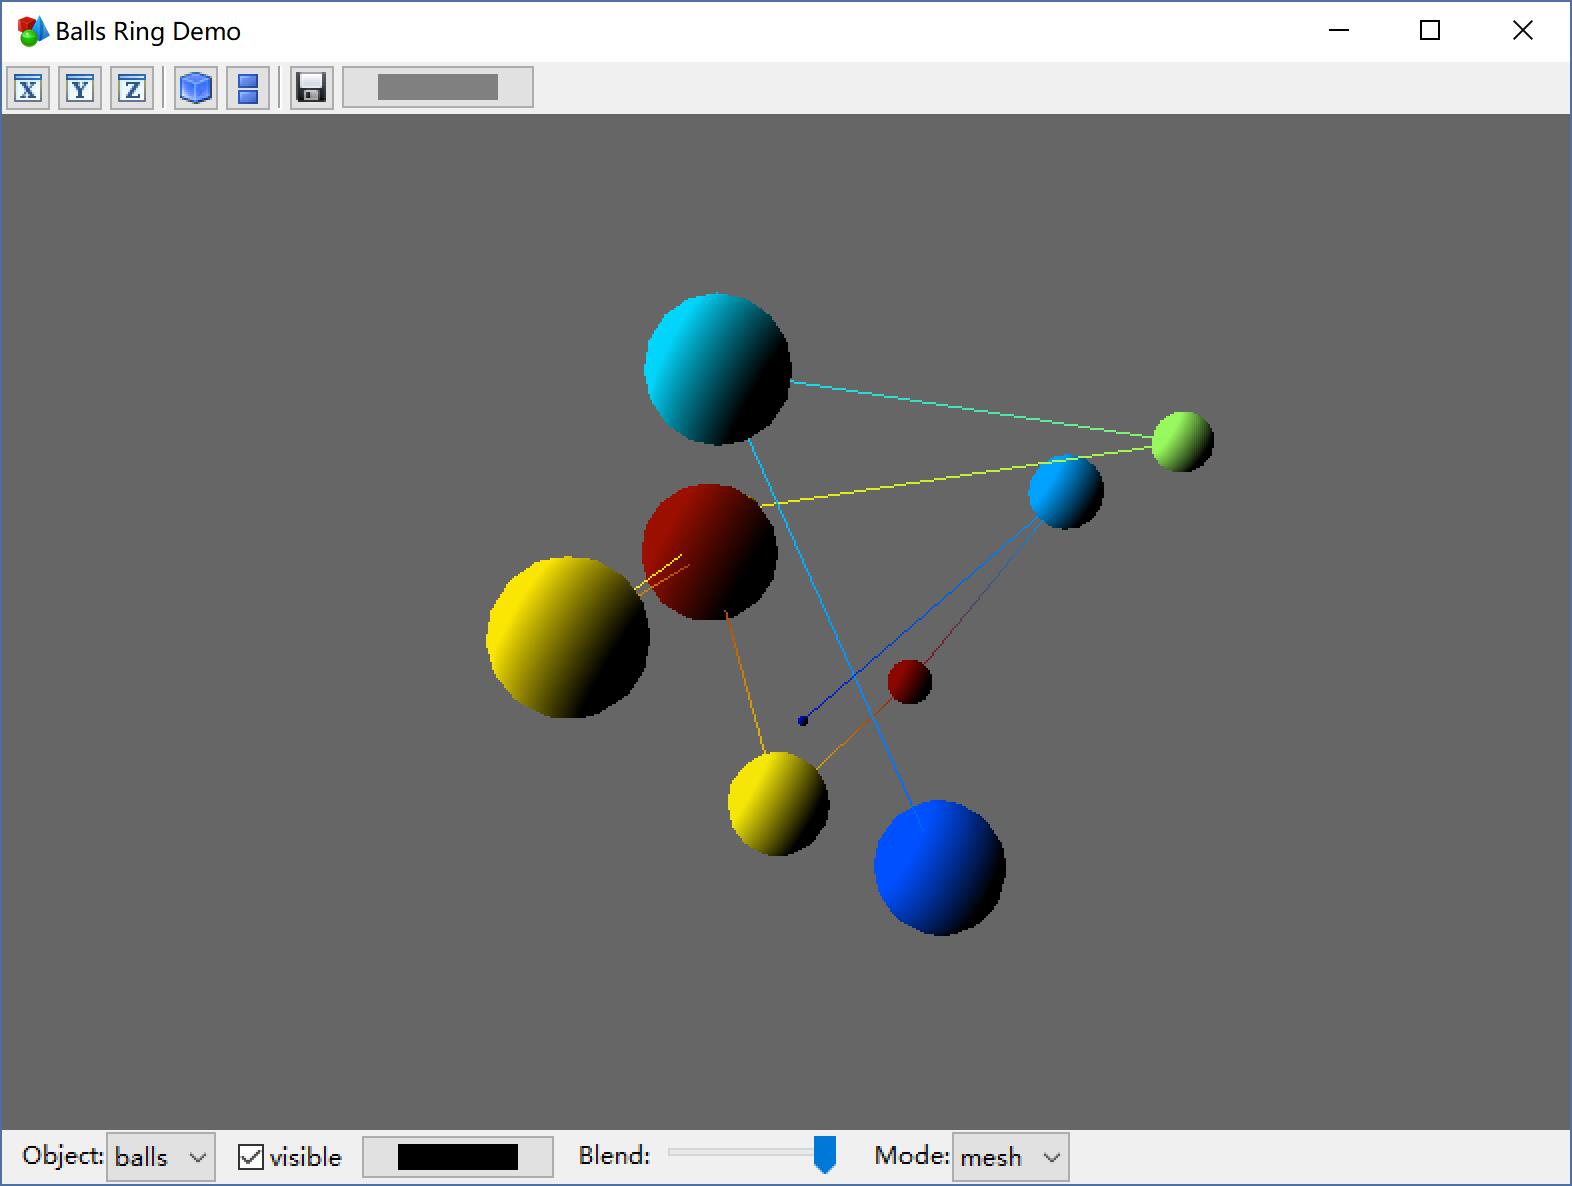
vts_b, fs_b, ns_b, cs_b = myvi.build_balls(list(os), list(rs), list(cs))
vts_l, fs_l, ns_l, cs_l = myvi.build_line(os[:,0], os[:,1], os[:,2], list(cs))
manager = myvi.Manager()
manager.add_surf('balls', vts_b, fs_b, ns_b, cs_b)
line = manager.add_surf('line', vts_l, fs_l, ns_l, cs_l)
line.set_style(mode='grid')
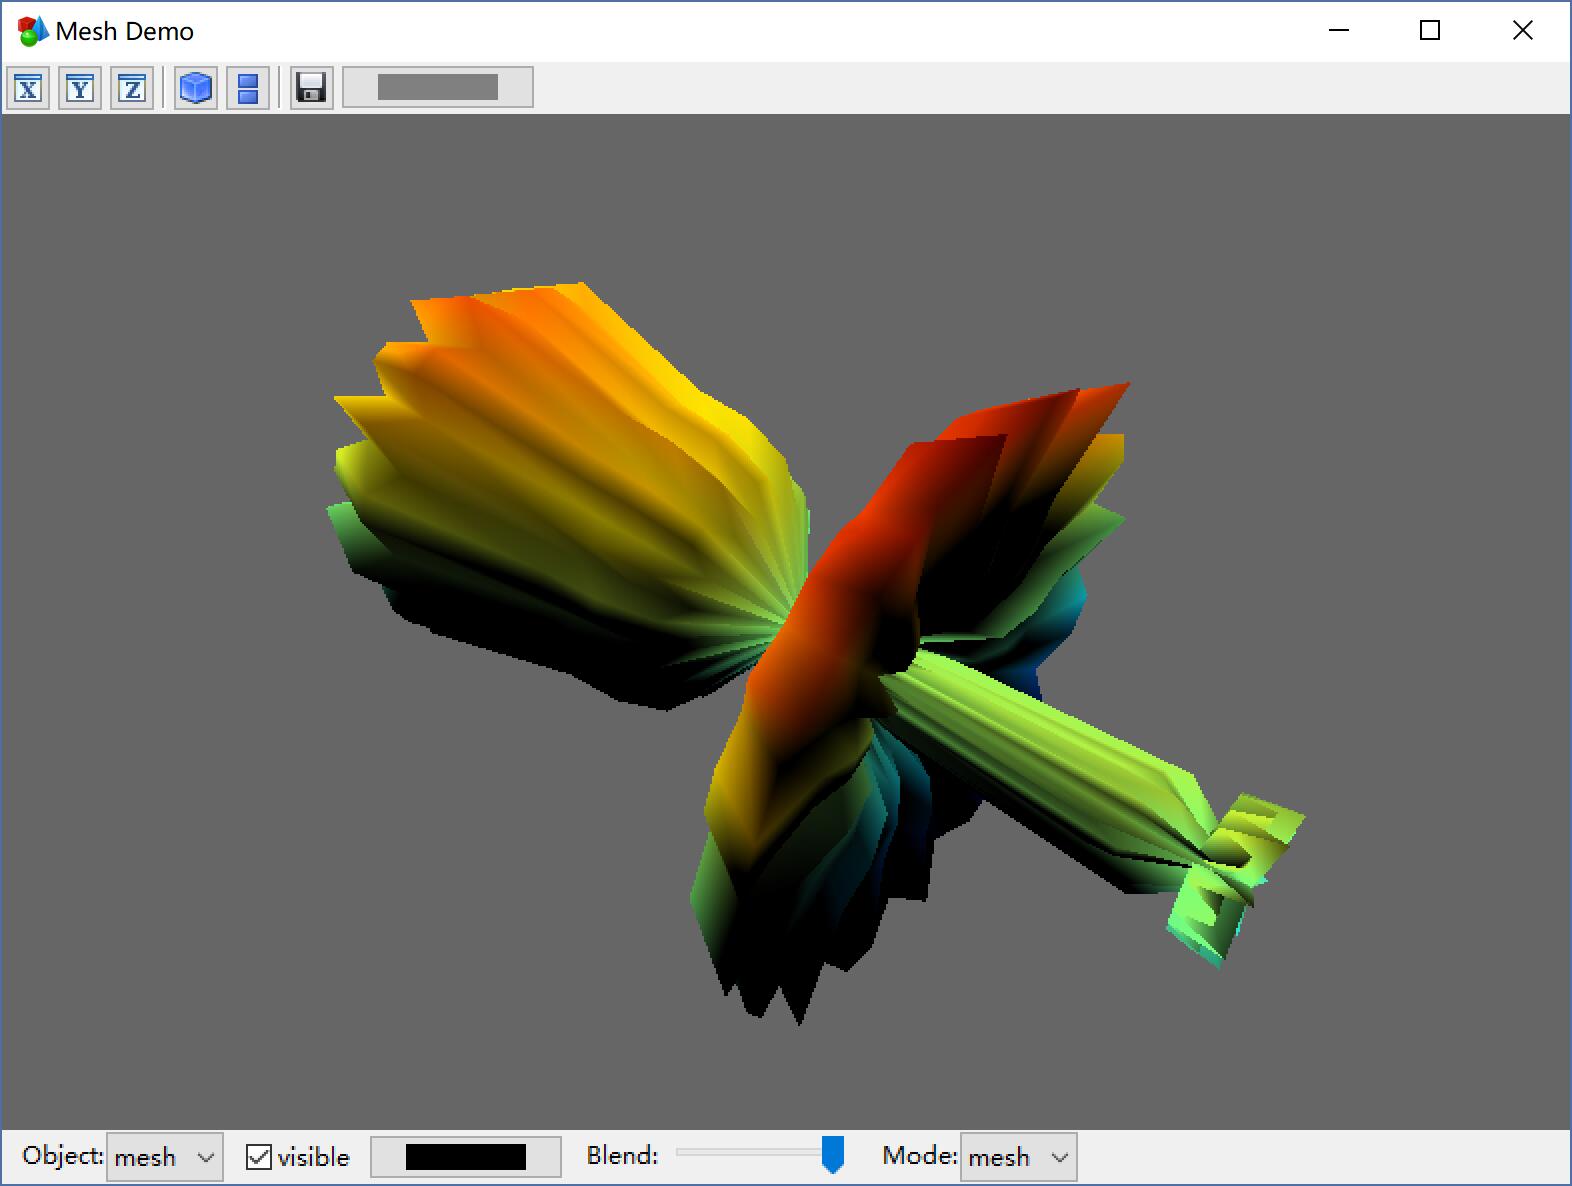
manager.show('Balls Ring Demo')dphi, dtheta = np.pi/20.0, np.pi/20.0
[phi,theta] = np.mgrid[0:np.pi+dphi*1.5:dphi,0:2*np.pi+dtheta*1.5:dtheta]
m0 = 4; m1 = 3; m2 = 2; m3 = 3; m4 = 6; m5 = 2; m6 = 6; m7 = 4;
r = np.sin(m0*phi)**m1 + np.cos(m2*phi)**m3 + np.sin(m4*theta)**m5 + np.cos(m6*theta)**m7
x = r*np.sin(phi)*np.cos(theta)
y = r*np.cos(phi)
z = r*np.sin(phi)*np.sin(theta)
vts, fs, ns, cs = myvi.build_mesh(x, y, z)
cs[:] = myvi.util.auto_lookup(vts[:,2], myvi.util.linear_color('jet'))/255
manager = myvi.Manager()
obj = manager.add_surf('mesh', vts, fs, ns, cs)
obj.set_style(mode='grid')
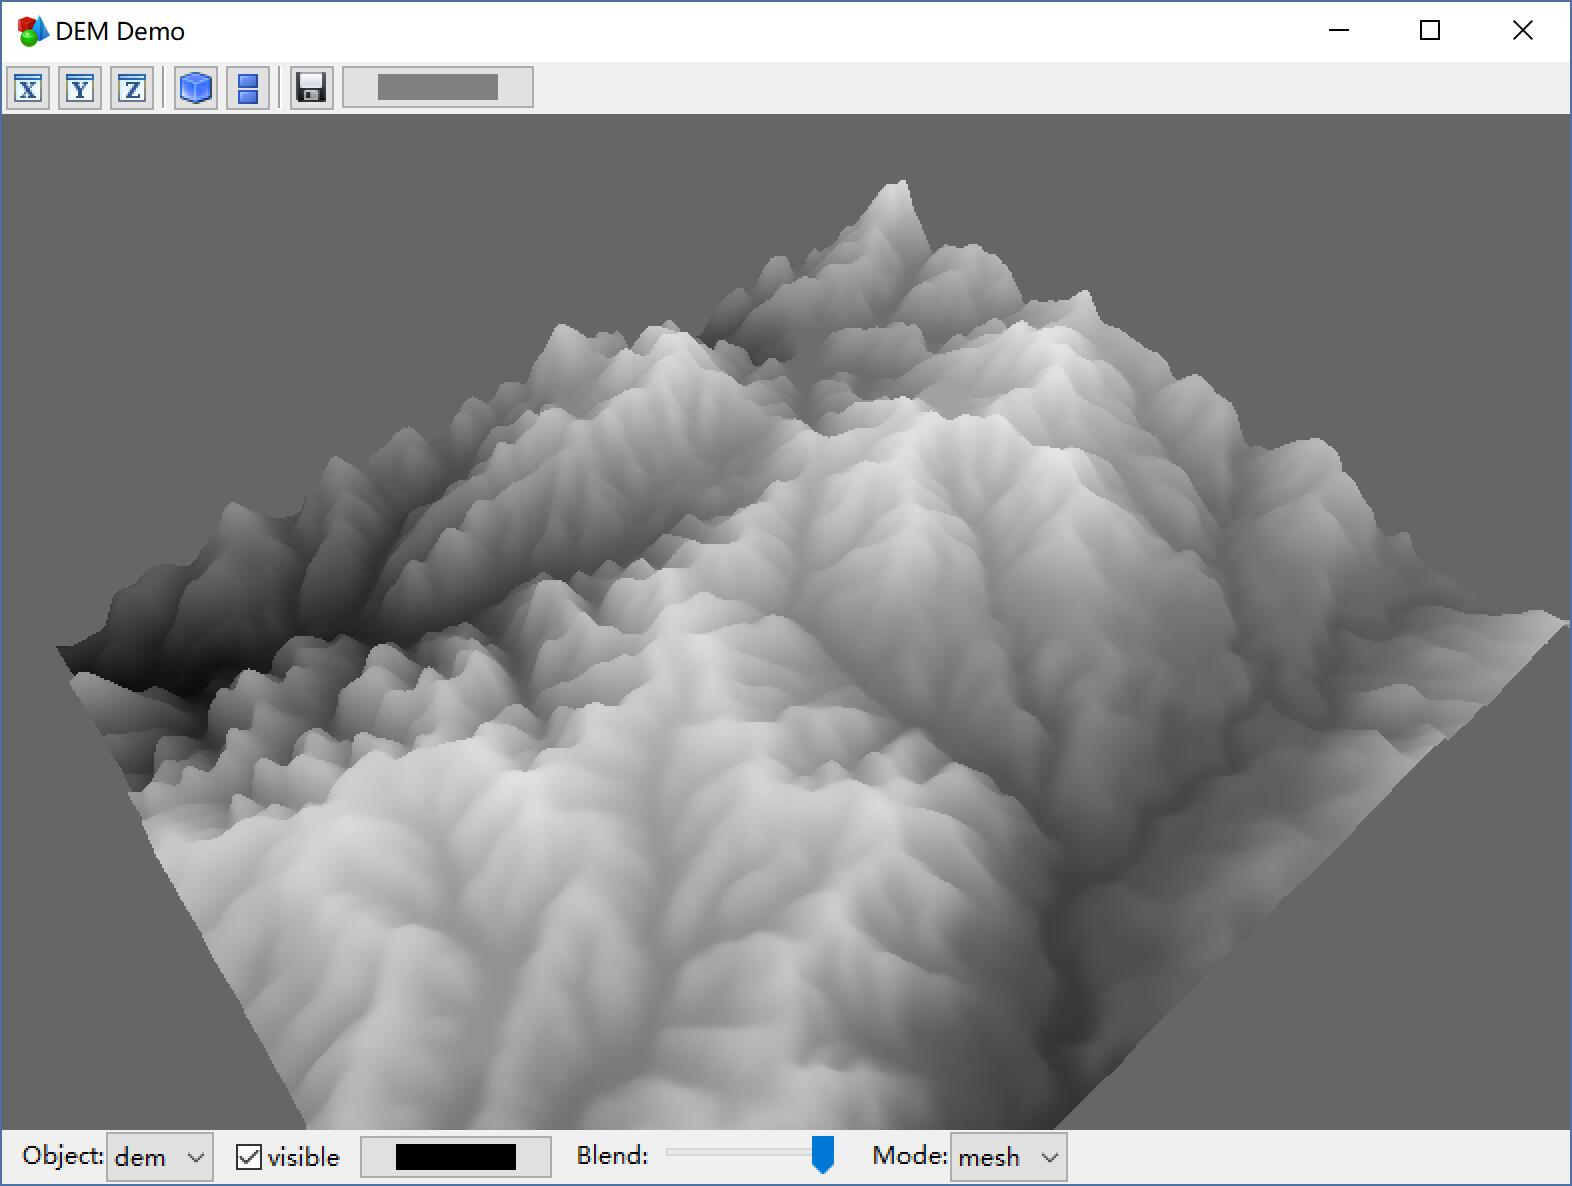
manager.show('Mesh Demo')img = imread('data/dem.png')
vts, fs, ns, cs = myvi.util.build_surf2d(img, ds=1, k=0.3, sigma=2)
manager = myvi.Manager()
manager.add_surf('dem', vts, fs, ns, cs)
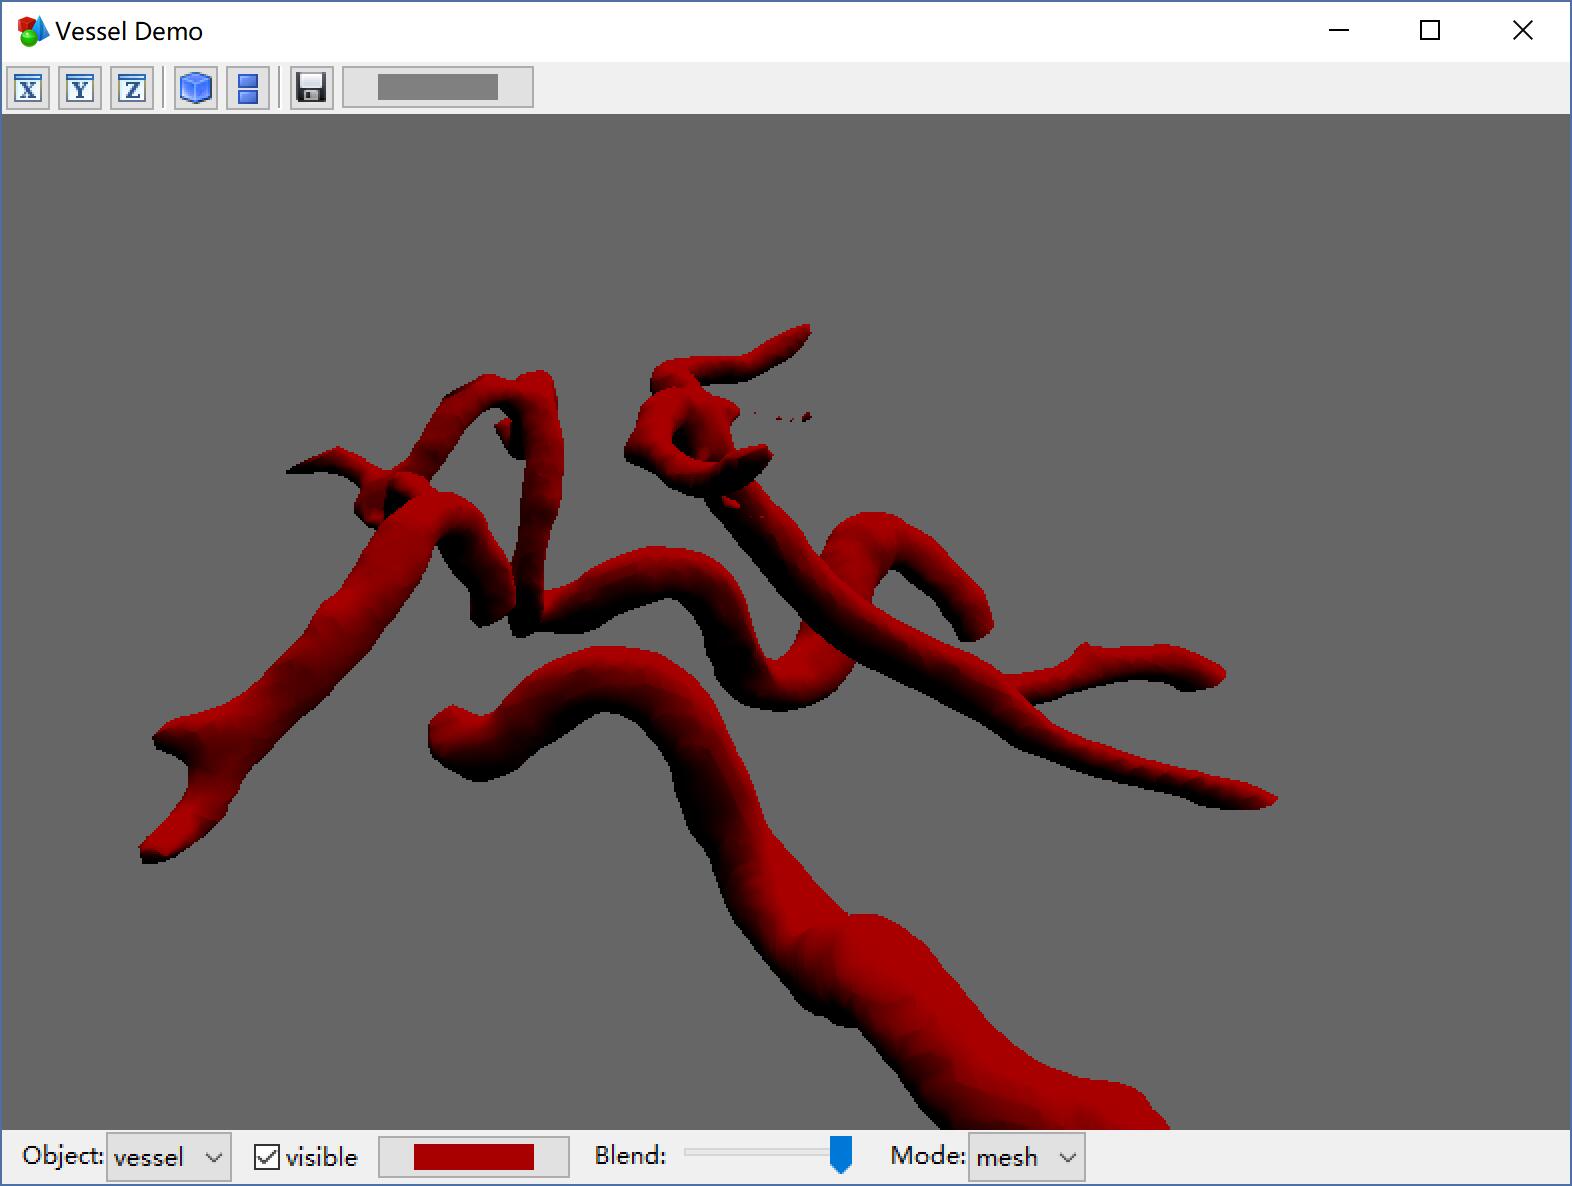
manager.show('DEM Demo')fs = glob('data/vessel*.png')
imgs = np.array([imread(i, True) for i in fs])
imgs = ndimg.gaussian_filter(imgs, 1)
vts, fs, ns, vs = myvi.util.build_surf3d(imgs, 1, 128)
manager = myvi.Manager()
manager.add_surf('vessel', vts, fs, ns, (1,0,0))
manager.show('Vessel Demo')myvi.Viewer3D is a wxpanel, which contains a manager, implements rendering and is interactive. You can just put the viewer into your program, then you can add objects in.
class YourFrame(wx.Frame):
   def __init__(self, parent, title='Frame3D', manager=None):
   	wx.Frame.__init__(...)
   	...
   	self.viewer = Viewer3D(self)
       self.viewer.add_surf('name', vts, fs, ns, cs)
...There are 4 modules in myvi:
- util: help to generate the geometry and colors
- manager: manage the render object
- canvas3d: a wx.GLCanvas panel, and a viewer3d panel
- frame3d: a simple Frame to wrap the viewer.
You can access the function by the module (myvi.util.build_surf2d), and you can also use myvi to access every function (myvi.build_surf2d).
Utilities help to generate geometry and colors. Every build function returns vts, fs, ns, cs which can then be added in the manager.
def build_surf2d(img, ds=1, sigma=0, k=0.2):
img: M x N ndarray of uint8
ds: how many pixel one sample
sigma: do a gaussian blur to smooth
k: scale on z axis
return: vts, fs, ns, cs
build_surf3d(imgs, ds, level, step=1, c=(1,0,0)):
imgs: M x N x K ndarray of uint8
ds: down sample
level: which value to march
step: how many pixel one step when marching
c: the color
return: vts, fs, ns, cs
build_ball(o, r, c=(1,0,0)):
o: center of ball
r: r of ball
color: color of ball
return: vts, fs, ns, cs
build_balls(os, rs, cs=(1,0,0)):
os: centers of balls
rs: rs of balls
cs: color of balls, can be a rgb tuple or a sequence like vts
return: vts, fs, ns, cs
build_mark(cont, pos, dz, h, color):
cont: the text (only support '0-9' and 'ID:')
pos: center of mark
dz: offset forward eye
h: height of text
color: color of text
return: vts, fs, pos, h, color
build_marks(cont, pos, dz, h, color):
cont: the text s(only support '0-9' and 'ID:')
pos: centers of mark
dz: offsets forward eye
h: heights of text
color: colors of text
return: vts, fs, pos, hs, colors
build_line(xs, ys, zs, c):
xs: x coordinates of line
ys: y coordinates of line
zs: z coordinates of line
color: color of line, can be a rgb tuple or a sequence like vts
return: vts, fs, ns, cs
build_lines(xs, ys, zs, cs):
xs: xs coordinates of lines
ys: ys coordinates of lines
zs: zs coordinates of lines
color: color of lines, can be a rgb tuple or a sequence like vts
return: vts, fs, ns, cs
build_mesh(xs, ys, zs, c=(1,0,0)):
xs: x coordinates of mesh
ys: y coordinates of mesh
zs: z coordinates of mesh
color: color of lines, can be a rgb tuple or a sequence like vts
return: vts, fs, ns, cs
linear_color(cs):
cs: list of colors
return: color
auto_lookup(vs, cmap):
vs: value of point
cmap: color map
return: color of every point
Surface is a geometry object.
init(self, vts, fs, ns, cs=(0,0,1)):
vts: vertex, ndarray of N x 3
fs: faces index of vertex, ndarray of N x 3
ns: normal vector of every
cs: colors, can be a rgb tuple or a sequence like vts
set_style(self, mode=None, blend=None, color=None, visible=None):
mode: set the render mode of object, grid or mesh
blend: set the blend of object
color: set the color of object, can be a rgb tuple or a sequence like xs
visible: set the visible of object, bool
Manage the objects, and their boundbox, background color, mvp matrix, etc.
add_surf(self, name, vts, fs, ns=None, cs=(0,0,1)):
name: object's name, you can use get_obj to find it later.
vts: vertex, ndarray of N x 3
fs: faces index of vertex, ndarray of N x 3
ns: normal vector of every
cs: colors, can be a rgb tuple or a sequence like vts
return: the Surface object
add_mark(self, name, vts, fs, o, h, cs=(0,0,1)):
name: object's name, you can use get_obj to find it later.
vts: vertex, ndarray of N x 3
fs: faces index of vertex, ndarray of N x 3
o: positions of mark
h: height of mark
cs: color of mark
return: the MarkText object
get_obj(self, name):
name: find the object by name, return None if not found
show(self, title='Myvi'):
Show a window when use manager to wrote a demo, just like matplotlib's plt.show(), when you embed Viewer3D in your Frame, you do not need to call it.
title: the title of the frame
The functions below, you do not need to call directly when using myvi as a api, unless you want to control it yourself
draw(self): render the objects
count_box(self): count the boundbox of all objects
count_mvp(self): count the mvp matrix
set_viewport(self, x, y, width, height): set viewport
set_background(self, rgb): set background color
reset(self, fovy=45, angx=0, angy=0): reset the view by given
set_pers(self, fovy=None, angx=None, angy=None, l=None, pers=None): set the perspect matrix
A wx.GLCanvas object, which to renders the object(s) and has a Manager object. You need not use it directly in general, because you can use Viewer3D, which you can control it easily.
A wx.Panel, which has a Canvas3D, and has a navigation bar, you can embed it in your Frame where you want.
init( self, parent, manager=None):
parent: parent frame
manager: if manager is given, viewer's Canvas3D object will use it, else a new empty manager is created.
add_surf(self, name, vts, fs, ns, cs, obj=None, mode=None, blend=None, color=None, visible=None):
you can create a manager, and add object to it, then use it to create a Viewer3D. But after the viewer is created, you should use viewer's add_surf to add object, this make sure the ui refresh.
add_surf_asyn(self, name, vts, fs, ns, cs, mode=None, blend=None, color=None, visible=None):
sometimes, we want to do some processing background (if the data is too large), then you should use add_surf_asyn instead.
https://github.com/Image-Py/imagepy
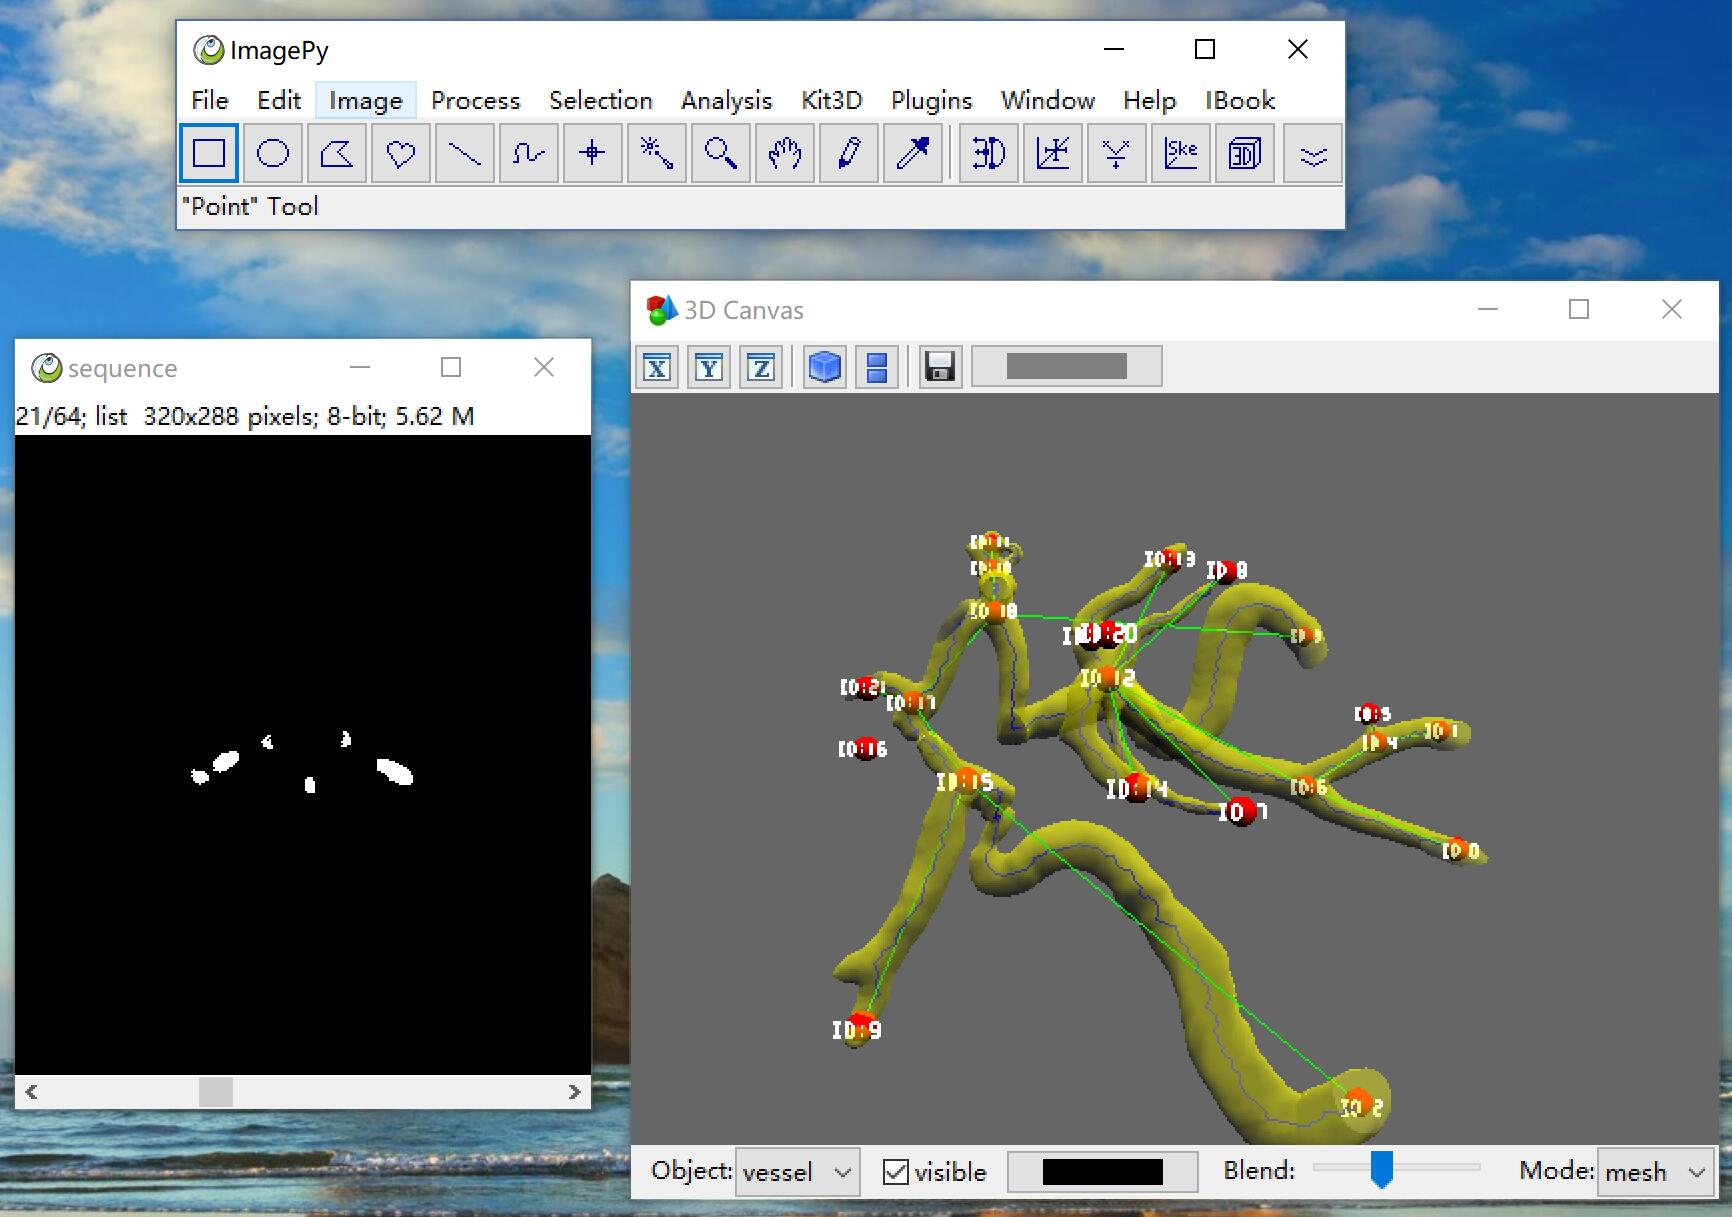
ImagePy is my opensource image processihng framework. It is the ImageJ of Python, you can wrap any numpy based function esaily. And Myvi is a sub module of ImagePy. You can use Myvi without any code.
On some computer it does not look well when the blend is set.
