Now that we can represent inputs and outputs, we can work on problem solving.
What stands between inputs(the problem) and outputs(the solution) are algorithms, which basically means step-by-step instructions for solving our problems.
Let's say we have an old-school phone book which contains names and phone numbers.
-
We might open the book and start from the first page, looking for a name one page at a time. This algorithm is correct, since eventually we'll find the name if it's in the book.
-
We might flip through the book two pages at a time, but this algorithm would be incorrect since we might skip the page that contains the name.
-
Another algorithm would be opening the phone book in the middle, decide wether our name will be in the left half or right half of the book and reduce the size of our problem by half. We can repeat this until we find our name.
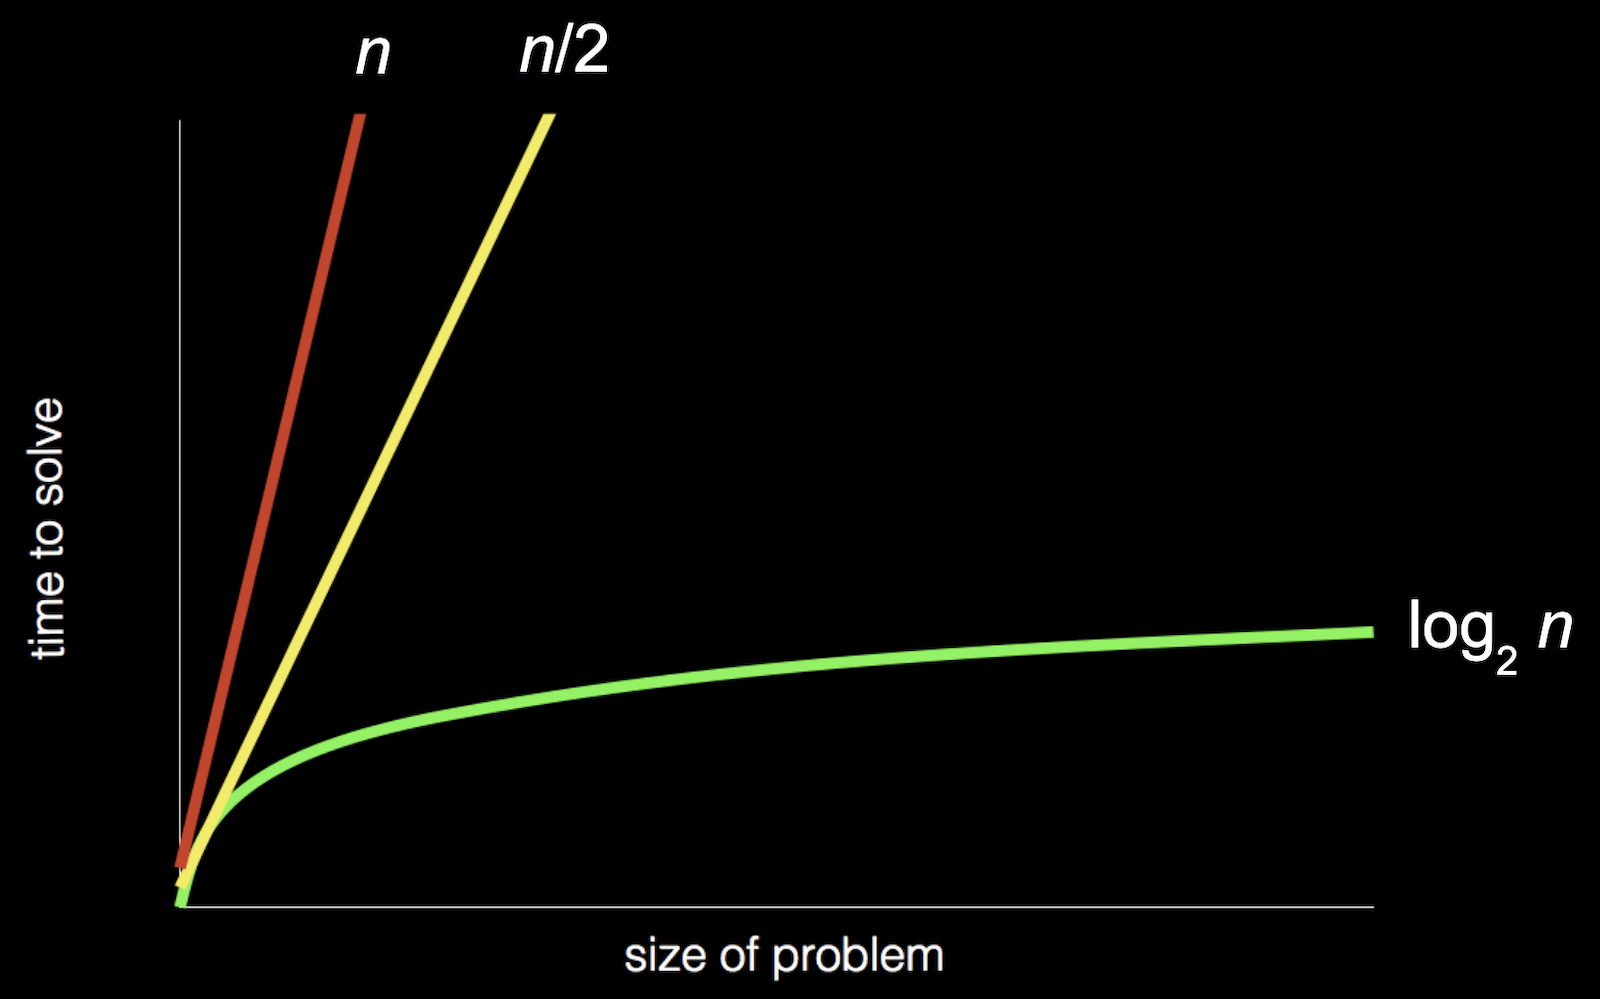
We can visualize the efficiency of each algorithms with this chart:
-
The first algorithm is represented by the red line. The 'time to solve' increases linearly as the size of the problem increases.
-
The second algorithm is represented by the yellow line.
-
The third algoritm is represented by the green line. It has a different relationship between the size of the problem and the time to solve it.
When looking at algorithms in general, to compare their efficiency we must consider two aspects: the running time and the space complexity.
In CS, the running time is oftenly described as the big O notation, which we can think of as "on the order of" something, as though we want to convey the idea of running time and not an exact number of milliseconds or steps.
Another definition of Big O - defines the runtime required to execute an algorithm by identifying how the performance of your algorithm will change as the input size grows.
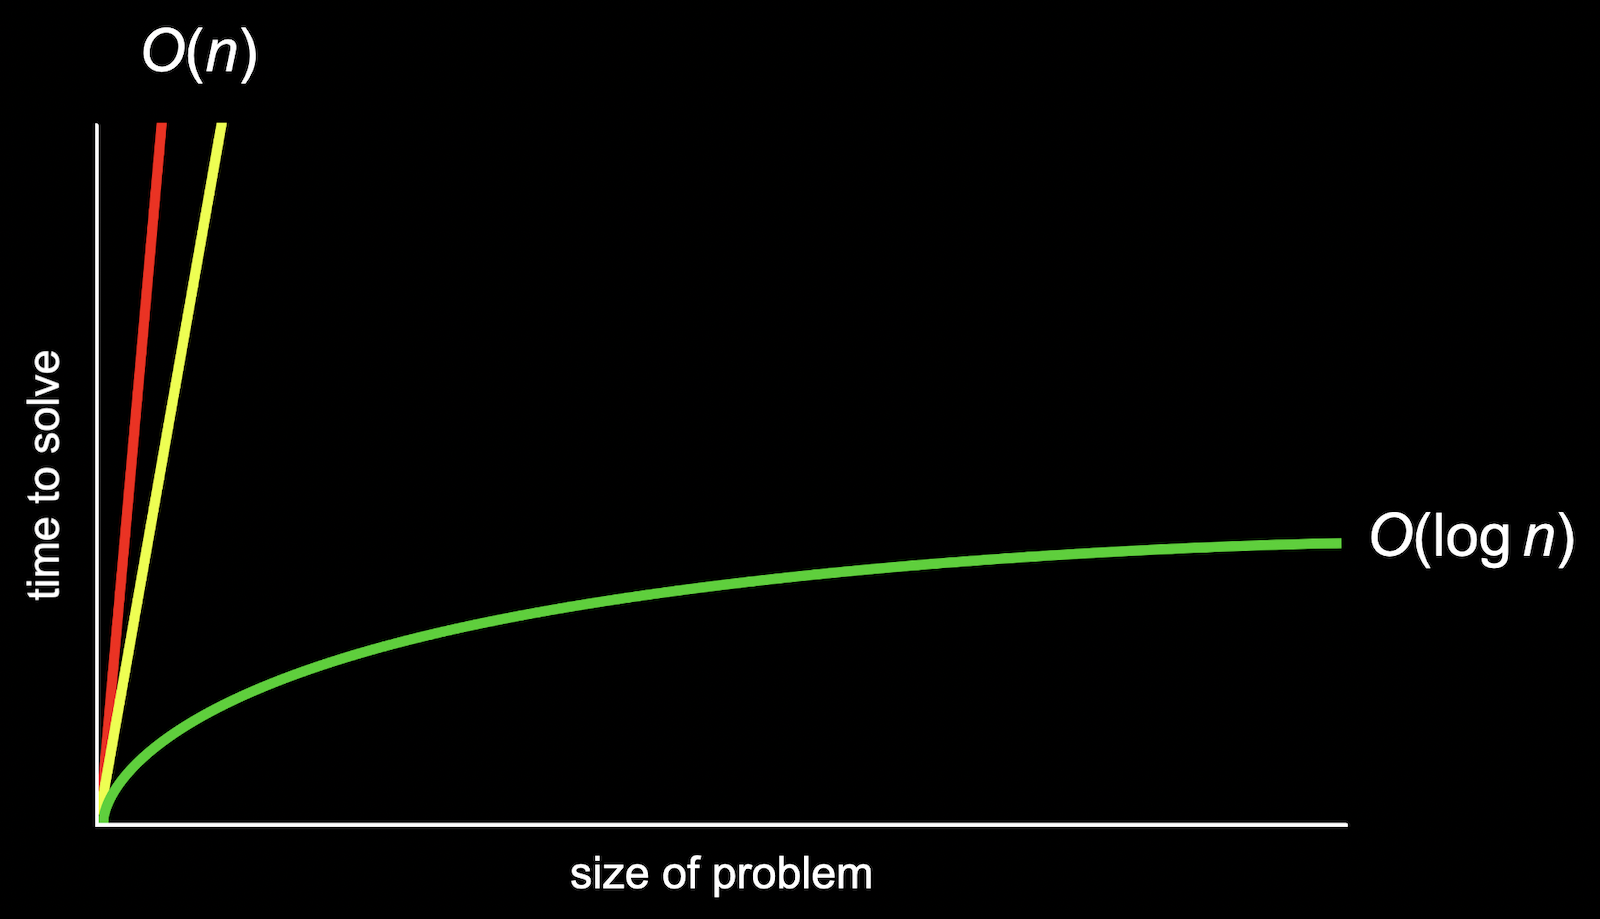
Reusing the chart from above where the red line is searching linearly (one page at a time), yellow line searching two pages at a time, and the green line, starting in the middle and dividing the problem in half each time.
If we'd zoom out and change the units on our axes, the red and yellow lines would end up very close together.
So we use big O notation to describe both the red and yellow lines, since they end up being very similar as n becomes larger and larger. We would describe them as both having "big O of n" or "on the order of n" running time.
The green line is different in shape even as n becomes very large, so it takes "big O of log n" steps. The base of the logarithm (2) is also removed since it's a constant factor.
As stated previously, the efficiency and performance of an algorithm is measured using time and space complexity.
A factor that affects program's efficiency and performance is the hardware (OS, CPU). These are not taken in consideration when analyzing an agorithm's performance. Instead, the time and space complexity as a function of the input's size are what matters.
Time complexity of an algorithm quantifies the amount of time taken by an algorithm to run as a function of the length of the input. The runtime is a function of the length of the input, not the actual execution time.
Space complexity specifies the total amount of space or memory required to execute an algorithm as a function of the size of the input
- Constant: O(1) -> Best
- Linear Time: O(n) -> Fair
- Logarithmic Time: O(n log n) -> Bad
- Quadratic Time: O(
$n^2$ ) -> Worst - Exponential Time: O(
$2^n$ ) -> Worst - Factorial Time: O(n!) -> worst
The following chart illustrates big O complexity:
- O(1) -> Best
- O(log n) -> Good
- O(n) -> Fair
- O(n log n) -> Bad
-
O(n!) O(
$2^n$ ) O($n^2$ ) -> Worst
How to know which algorithm has which time complexity:
- when calculation is not depended on the input size, it is a constant time complexity (O(1)).
- when the input size is reduced by half, maybe when iterating, handling recursion, etc, it is a logarithmic time (O(log n)).
- when you have a single loop within your algorithm, it is linear time complexity (O(n)).
- when you have nested loops within your algorithm, it is quadratic time complexity (O(
$n^2$ )). - when the growth rate doubles with each addition to the input, it is exponential time complexity (O(
$2^n$ )). - when it grows in a factorial way based on tthe size of the input, it is factorial time complexity (O(n!)).
Similar to the big O notation, big Omega notation or
The difference between the two, is that big O is used to describe the worst case running time, while
Common 'Big
$\Omega$ ($n^2$ )$\Omega$ (n log n)$\Omega$ (n)$\Omega$ (log n)$\Omega$ (1)
The big Theta notation, or
There's also a notation which describes the running times of algorithms if the upper bound and lower bound are the same: the Theta notation or
Common 'Big
$\Theta$ ($n^2$ )$\Theta$ (n log n)$\Theta$ (n)$\Theta$ (log n)$\Theta$ (1)


